(T2108 measures the percentage of stocks trading above their respective 40-day moving averages [DMAs]. It helps to identify extremes in market sentiment that are highly likely to reverse. To learn more about it, see my T2108 Resource Page. You can follow real-time T2108 commentary on twitter using the #T2108 hashtag. T2108-related trades and other trades are posted on twitter using the #120trade hashtag)
T2108 Status: 52.1%
VIX Status: 17.1
General (Short-term) Trading Call: Hold (consider closing shorts)
Reference Charts (click for view of last 6 months from Stockcharts.com):
S&P 500 or SPY
SDS (ProShares UltraShort S&P500)
U.S. Dollar Index (volatility index)
VIX (volatility index)
VXX (iPath S&P 500 VIX Short-Term Futures ETN)
EWG (iShares MSCI Germany Index Fund)
CAT (Caterpillar)
Commentary
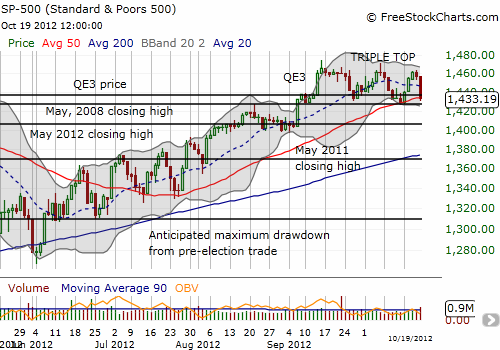
For the second time this month, the S&P 500 failed at resistance at the 52-week and near 5-year high. The S&P 500 proceeded to sell off in the wake of the latest failure, just like the last failure. The S&P 500 has now plunged to and around support three times in a month. Each decline has wiped out the brief gains from QE3, and I suspect this display of weakness confirms what looks like a triple top.

This chart shows how various supports have played out since QE3. First, the QE3 price held. Next, the QE3 price failed but the May, 2008 closing high held right at the 50DMA. Finally, the 50DMA held marginally. Once (if?) this pattern gives way, I expect a rapid move to support from the May, 2012 closing high.
In the last T2108 update, I gave the green light to opening shorts. I had little time to do so at Friday’s open and by the end of the day, I realized that the sell-off might be opening an opportunity to play another “obligatory bounce” off support. Accordingly, I bought SSO calls. This time, I think the bounce will occur as a result of the Federal Reserve announcement of monetary policy on Wednesday, directly or indirectly. The Federal Reserve must be disappointed with the complete lack of progress since announcing QE3 last month, so I expect some attempt to jawbone the markets into responding as originally expected. I will immediately sell into such a bounce and look for another signal to short.
Earnings season has started in a very rocky fashion. However, I will not be surprised if the earnings news this week sounds better than last week, at least on a relative basis. By the time earnings season ends, negative news will be old news. Thus, I am not looking for a major sell-off in the next few weeks as a result of this ominous triple top: a drop to or around 1400 is only a 2.3% drop from current levels. In fact, I will not be surprised if the year ends around current levels even as the market swoons and rallies multiple times. I am also assuming the triple top will hold as resistance until at least year-end. I am keeping this in mind when making short-term trades.
Daily T2108 vs the S&P 500

Black line: T2108 (measured on the right); Green line: S&P 500 (for comparative purposes)
Weekly T2108

*All charts created using freestockcharts.com unless otherwise stated
Related links:
The T2108 Resource Page
Expanded daily chart of T2108 versus the S&P 500
Expanded weekly chart of T2108
Be careful out there!
Full disclosure: long SSO calls
