(T2108 measures the percentage of stocks trading above their respective 40-day moving averages [DMAs]. It helps to identify extremes in market sentiment that are highly likely to reverse. To learn more about it, see my T2108 Resource Page. You can follow real-time T2108 commentary on twitter using the #T2108 hashtag. T2108-related trades and other trades are posted on twitter using the #120trade hashtag)
T2108 Status: 70.4%
VIX Status: 14.6
General (Short-term) Trading Call: Hold
Reference Charts (click for view of last 6 months from Stockcharts.com):
S&P 500 or SPY
SDS (ProShares UltraShort S&P500)
U.S. Dollar Index (volatility index)
VIX (volatility index)
VXX (iPath S&P 500 VIX Short-Term Futures ETN)
EWG (iShares MSCI Germany Index Fund)
CAT (Caterpillar)
Commentary
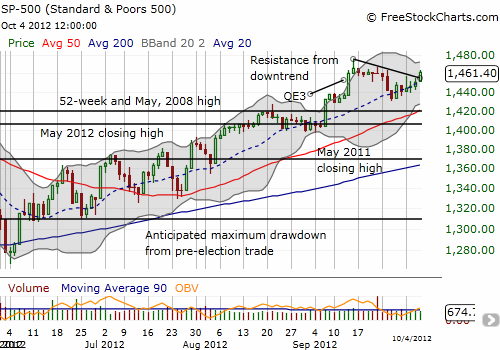
The S&P 500 made a bullish breakout from the wedge formation I have been following this week.

This breakout is occurring directly ahead of tomorrow’s jobs report and suggests that the market is likely to react well to it. This breakout also means that the bearish divergence I noted yesterday between the S&P 500’s gains and T2108’s losses are now null and void. Instead, the apparent bottoming in the Australian dollar (FXA) won the day.
T2108 is right back in overbought territory, but I am not yet rolling out the standard T2108 trading rules. Typically at this time, I would recommend starting a bearish position. Instead, I am recommending holding onto bullish positions (in my case my remaining SSO calls) to allow the bullish formation to run its course. If the S&P 500 rallies strongly tomorrow, I will most likely sell these remaining calls. I am still avoiding going short until the bears prove they are breaking the market. I may consider a short position if T2108 gets to an extreme overbought position over 80%.
Finally, I am not yet ready to reconsider using the extended overbought strategy because of earnings season and a whole host of negative reports and warnings that I have seen so far.
Daily T2108 vs the S&P 500
Click chart for extended view with S&P 500 fully scaled vertically (updated at least once a week)

Black line: T2108 (measured on the right); Green line: S&P 500 (for comparative purposes)
Weekly T2108

*All charts created using freestockcharts.com unless otherwise stated
Related links:
The T2108 Resource Page
Expanded daily chart of T2108 versus the S&P 500
Expanded weekly chart of T2108
Be careful out there!
Full disclosure: long SSO calls
