(T2108 measures the percentage of stocks trading above their respective 40-day moving averages [DMAs]. It helps to identify extremes in market sentiment that are highly likely to reverse. To learn more about it, see my T2108 Resource Page. You can follow real-time T2108 commentary on twitter using the #T2108 hashtag. T2108-related trades and other trades are posted on twitter using the #120trade hashtag)
T2108 Status: 65.9%
VIX Status: 15.4
General (Short-term) Trading Call: Hold
Reference Charts (click for view of last 6 months from Stockcharts.com):
S&P 500 or SPY
SDS (ProShares UltraShort S&P500)
U.S. Dollar Index (volatility index)
VIX (volatility index)
VXX (iPath S&P 500 VIX Short-Term Futures ETN)
EWG (iShares MSCI Germany Index Fund)
CAT (Caterpillar)
Commentary
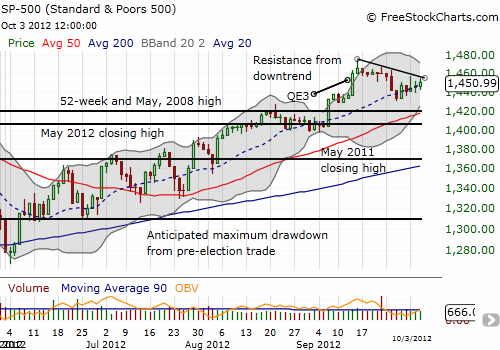
The S&P 500 closed just under the wedge I pointed out in the last T2108 Update.

At this point, I would normally assume an upside breakout to a wedge formation. However, T2108 actually DECLINED today, from 67.9% to 65.9%. This is not a huge difference but it was nonetheless surprising given the S&P 500 managed a marginal gain that took it to the upper limits of the wedge. This bearish divergance suggests that the more likely path is back down to the bottom of the wedge.
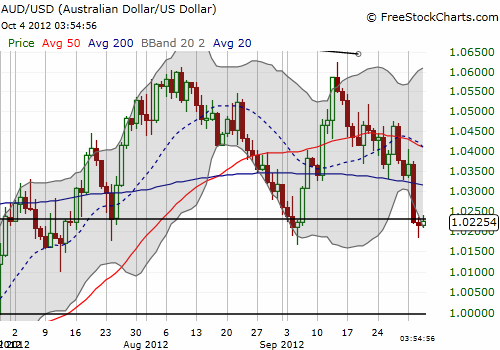
The huge caveat to this conclusion is the Australian dollar (FXA). AUD/USD looks like it is bottoming right at support formed by the closes for 2010 and 2011. The chart below zooms in on the action since July to clearly show the impact of this support line (the thick, black horizontal line under 1.02500). If this bottom truly holds up, I will have to get bullish on the S&P 500 given the strong relationship between the S&P 500 and the Australian dollar.

It seems unlikely that the wedge will break ahead of Friday’s labor report, so I am not expecting anything big for Thursday…but I am still watching warily.
On a quick sidenote, speaking of sitting right on the edge of resistance…Yelp.com (YELP) closed EXACTLY at its all-time closing high. As I mentioned in the last T2108 Update, YELP seems poised for a big breakout given its behavior at this line of resistance is so different, and more constructive, than earlier blow-off tops.
Daily T2108 vs the S&P 500
Click chart for extended view with S&P 500 fully scaled vertically (updated at least once a week)

Black line: T2108 (measured on the right); Green line: S&P 500 (for comparative purposes)
Weekly T2108

*All charts created using freestockcharts.com unless otherwise stated
Related links:
The T2108 Resource Page
Expanded daily chart of T2108 versus the S&P 500
Expanded weekly chart of T2108
Be careful out there!
Full disclosure: long SSO calls, YELP puts
