(T2108 measures the percentage of stocks trading above their respective 40-day moving averages [DMAs]. It helps to identify extremes in market sentiment that are highly likely to reverse. To learn more about it, see my T2108 Resource Page. You can follow real-time T2108 commentary on twitter using the #T2108 hashtag. T2108-related trades and other trades are posted on twitter using the #120trade hashtag)
T2108 Status: 66.7% (ends a 1-day overbought period)
VIX Status: 15.7
General (Short-term) Trading Call: Hold (increase bearish bias)
Reference Charts (click for view of last 6 months from Stockcharts.com):
S&P 500 or SPY
SDS (ProShares UltraShort S&P500)
U.S. Dollar Index (volatility index)
VIX (volatility index)
VXX (iPath S&P 500 VIX Short-Term Futures ETN)
EWG (iShares MSCI Germany Index Fund)
CAT (Caterpillar)
Commentary
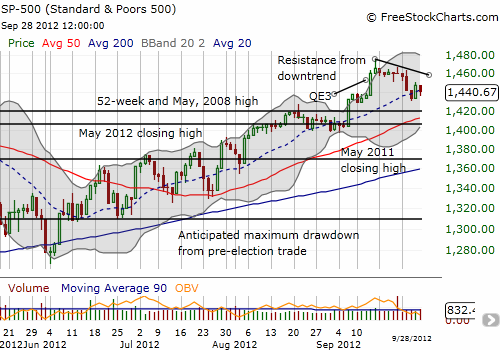
On Friday, the S&P 500 pulled back again, but the 20DMA continues to hold. The index was down 4 out of 5 days last week. While the initial selling met my expectations, I was also anticipating a strong finish to the week, to the month, and to the third quarter.

T2108 dropped out of overbought territory making the last visit a duration of just 1 day. I am interpreting the sudden inability to hold overbought status as increasingly bearish and another sign of a wavering market. As I am typing, the euro and the Australian dollar are surging. This is supportive of a strong open to the U.S. trading session; various European indices are up around 1%. However, I am sticking with my decision last week to drop the aggressive buying of the extended overbought strategy. Instead, I will use a re-entry to overbought status to eagerly unload several longs, including the last tranche of SSO calls purchased Friday (I actually was able to do a roundtrip on Friday).
I am starting to suspect that the S&P 500 will remain rangebound through earnings season unless some surprisingly positive catalyst emerges to hurtle the market forward. I will get more bullish if/once the current short-term downtrend ends and/or the S&P 500 hits new 52-week (and 4+ year) highs. I will not chase anything upward (of course I never do anyway), but will more eagerly buy dips in the wake such activity. This expectation also means I am not eager to fade the market. I am content for now to wait until the bears can prove they have the muscle to break the S&P 500’s steady uptrend from the June 1st lows. From current levels, the uptrend ends if the S&P 500 closes below the 50DMA and follows through with selling that takes the index below 1400 – this would erase all gains from the breakout on September 6th. Hopefully T2108 will not be oversold by then!
In the meantime, I am gearing up for earnings season. I am expecting a very volatile three weeks or so. Many companies will produce guidance for 2013. They should be relatively conservative given the macro risks and uncertainties. This is a message that will likely not sit well with the market. Stay tuned!
Daily T2108 vs the S&P 500
Click chart for extended view with S&P 500 fully scaled vertically (updated at least once a week)

Black line: T2108 (measured on the right); Green line: S&P 500 (for comparative purposes)
Weekly T2108

*All charts created using freestockcharts.com unless otherwise stated
Related links:
The T2108 Resource Page
Expanded daily chart of T2108 versus the S&P 500
Expanded weekly chart of T2108
Be careful out there!
Full disclosure: long SSO calls
