(T2108 measures the percentage of stocks trading above their respective 40-day moving averages [DMAs]. It helps to identify extremes in market sentiment that are highly likely to reverse. To learn more about it, see my T2108 Resource Page. You can follow real-time T2108 commentary on twitter using the #T2108 hashtag. T2108-related trades and other trades are posted on twitter using the #120trade hashtag)
T2108 Status: 70.4% (overbought day #14)
VIX Status: 15.4
General (Short-term) Trading Call: Hold (extended overbought strategy remains in effect)
Reference Charts (click for view of last 6 months from Stockcharts.com):
S&P 500 or SPY
SDS (ProShares UltraShort S&P500)
U.S. Dollar Index (volatility index)
VIX (volatility index)
VXX (iPath S&P 500 VIX Short-Term Futures ETN)
EWG (iShares MSCI Germany Index Fund)
CAT (Caterpillar)
Commentary
On Friday of last week I tweeted the following:
“Next week is last trading week for Q3. With $AUDUSD sagging I am thinking $SPY sells off to start week, rallies to end, goes nowhere overall”
This projection was entirely based on assessing the technicals on the Australian dollar (AUD/USD) using a framework that has consistently provided leading and confirming indicators for moves on S&P 500. You can review a detailed analysis of the intraday relationships in “How To Estimate Intraday Moves For The S&P 500 Using The Australian Dollar.”
So far, so good with this projection. It came after noting the tenuous technical setup in the stock market in the last T2108 Update titled “Warily Waiting for the Next Ramp Up.” The S&P 500 was down slightly Monday, but Tuesday delivered the blow that has almost erased the brief gains from the last Federal Reserve meeting when QE3 was announced.
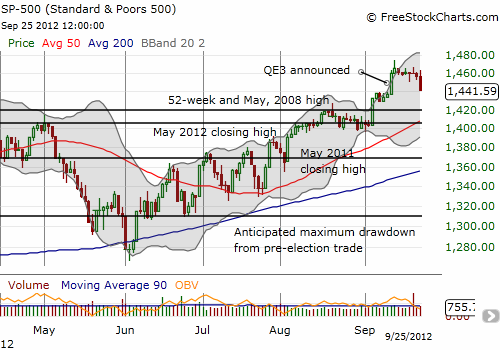
This drop took T2108 to 70.4%, right on the edge of overbought. I think this is the perfect set-up for the bounce I am anticipating to flatten out the week. However, this is a very close call. My rules for this overbought period end if the S&P 500 CLOSES below the low of QE3-day and/or the overbought period ends; the simple logic is that it signifies that the bears and sellers are finally taking control of the market. The index is on the edge of satisfying both bearish conditions. The S&P 500 is trading on a razor thin edge that divides my thinking between bear and bull. Note that if the S&P 500 closes low enough to end my extended overbought strategy, I am NOT switching to the bear side just yet. Instead, it will take a break of the uptrend in place since the June lows (unless of course T2108 somehow switches to oversold at that time). I am loosely defining that point as a CLOSE below the 50DMA.
On Friday, I was able to sell my last tranche of SSO calls near the highs of the day. I managed to eke by with a small profit before the S&P 500 tumbled back to end the day flat. For Thursday’s T2108 Update, I mentioned that I was hoping for a strong open to allow me to sell for at least breakeven. The new tranche I bought near Monday’s low looked good through Tuesday’s open before the market sank. I failed to add a second tranche of SSO calls as the rules require, but I plan to do so on Wednesday’s open.
There remain plenty of reasons for caution, and the list continues to grow. Here are some of the things I am watching warily in no particular order.
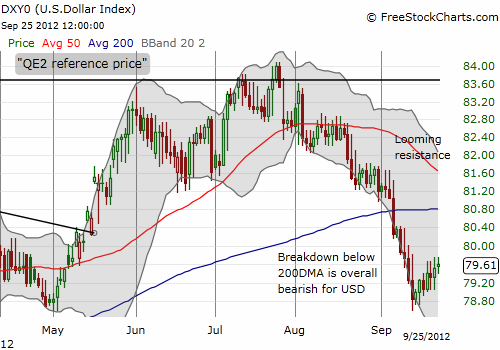
- The U.S. dollar continues to strengthen. I expected last week to feature stabilization for the dollar, but the continued strength is a warning sign given buyers are snapping up dollars despite the promise of increasing supply every month.
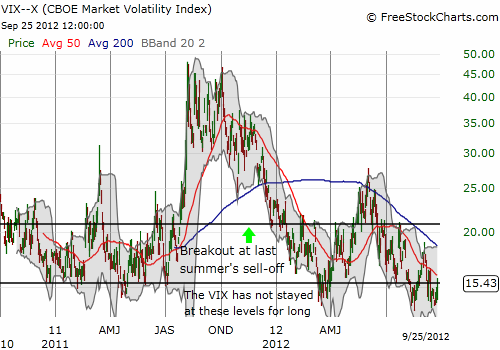
- The VIX has stubbornly held support that has endured for over a year. At some point, we have to expect the volatility index to rally sharply off this support.
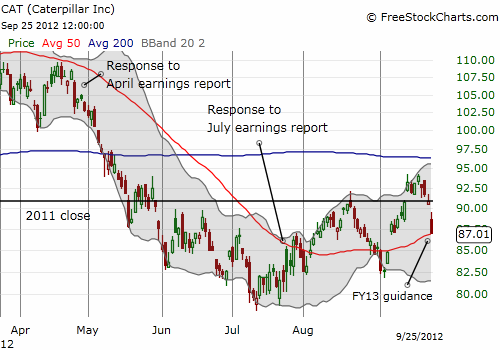
- Caterpillar (CAT), my favorite canary in the coal mine, issued FY13 and long-term guidance that the market did not like. This caused CAT to gap down below the support/resistance formed by 2011’s close. CAT is negative for the year again.
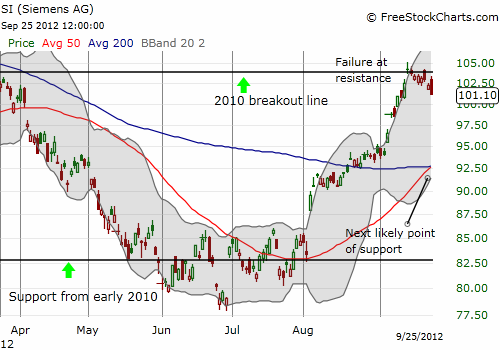
- Siemens Atkins (SI) is now tumbling from 2010’s breakout line. This move confirms this line is serving as resistance, suggesting SI will now tumble to its next natural support which is not until the 50 and 200DMAs about 7% away.
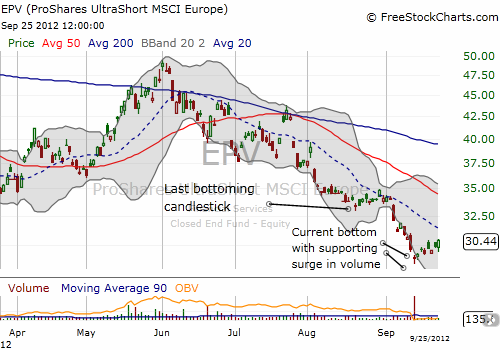
- Adding to my increasing wariness on the “euro-panic” trade is the steady bounce in ProShares UltraShort MSCI Europe (EPV). This bounce is only remarkable because it follows a high volume selling day that formed a bottoming hammer pattern. Given the high volume, it looks much more convincing than the last one that failed after two weeks.
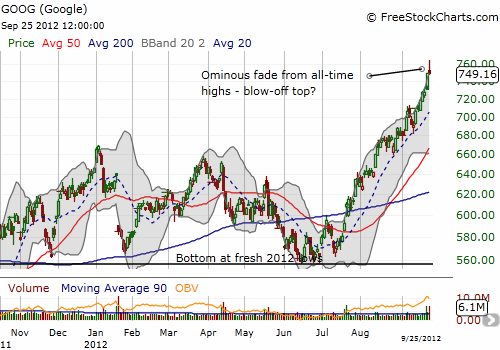
One interesting counterpoint had been Google (GOOG). The stock soared as much as 200 points for an amazing 35% gain in just the last two months. Apparently, no one really knows why GOOG has suddenly become so hot, but that run looks like it finally ended with today’s sell-off. GOOG went from a 1.9% gain to a flat close on very heavy volume: 6.1M shares traded versus a 3-month rolling average of 2.4M shares. This strong fade after a long and strong run creates a topping pattern that gets confirmed with follow-through selling – a blow-off top. Wednesday morning, I am looking to sell a GOOG call spread that I own to lock in profits that are not worth leaving at risk hoping GOOG will close the week above the strike of my short side of the spread..
Below, I provide charts for each of these points. I will have my eyes on all of them even as I expect end-of-month and end-of-quarter portfolio-painting to bring buyers back to the table by Wednesday’s close and definitely by Thursday.
Daily T2108 vs the S&P 500
Click chart for extended view with S&P 500 fully scaled vertically (updated at least once a week)

Black line: T2108 (measured on the right); Green line: S&P 500 (for comparative purposes)
Weekly T2108

*All charts created using freestockcharts.com unless otherwise stated
Related links:
The T2108 Resource Page
Expanded daily chart of T2108 versus the S&P 500
Expanded weekly chart of T2108
Be careful out there!
Full disclosure: long SSO calls, long EPV, VXX, and CAT shares, long GOOG call spread
