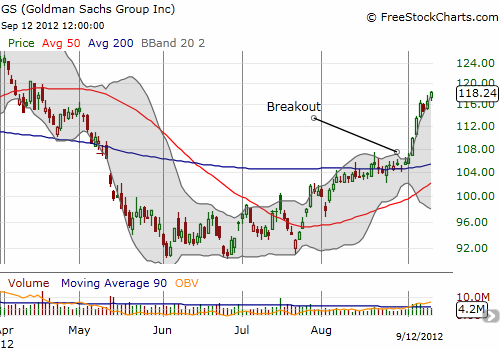
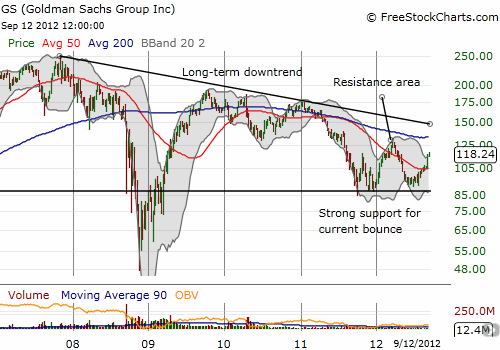
Goldman Sachs (GS) has been on a tear lately. Since breaking out on September 5th, the stock is up about 11%. The first three days of the breakout move featured strong volume, above the moving 90-day average. GS is now challenging a major resistance area formed by a head and shoulders type pattern from 2012’s peak.
The charts below provide a close-up daily to see the breakout and a longer-term weekly to see the resistance area and the longer-term downtrend that still faces GS on the way up. Note the strong support GS received from 2011’s lows – an actual triple-bottom.


Source for charts: FreeStockCharts.com
I have yet to see any news items that can help explain this sudden burst in excitement over GS. I have to assume for now that the market is anticipating some big news. Regardless, this bounce is a very bullish sign for GS (the stock is well above critical 50 and 200DMA support levels) and perhaps for financials and the stock market in general. Stay tuned!
Be careful out there!
Full disclosure: long GS
