(T2108 measures the percentage of stocks trading above their respective 40-day moving averages [DMAs]. To learn more about it, see my T2108 Resource Page. You can follow real-time T2108 commentary on twitter using the #T2108 hashtag. T2108-related trades and other trades are posted on twitter using the #120trade hashtag)
T2108 Status: 65.8%
VIX Status: 16.0
General (Short-term) Trading Call: Lock in some profits on longs otherwise hold (assuming bearish positions already in place). Trading bias goes to the bears.
Reference Charts (click for view of last 6 months from Stockcharts.com):
S&P 500 or SPY
SDS (ProShares UltraShort S&P500)
U.S. Dollar Index (volatility index)
VIX (volatility index)
VXX (iPath S&P 500 VIX Short-Term Futures ETN)
EWG (iShares MSCI Germany Index Fund)
CAT (Caterpillar)
Commentary
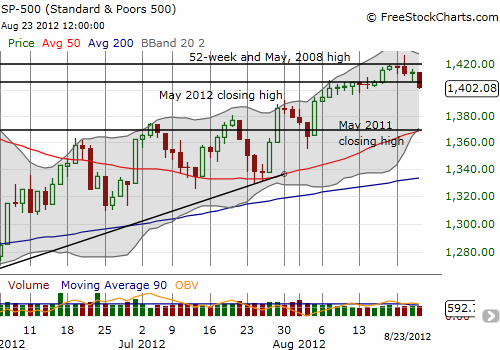
On Tuesday, August 21, I warned about a potential topping pattern as the S&P 500 faded from multi-year highs to end the day lower. Today, we received confirmation of the top with the index punching through its first line of natural support, the May highs from this year.

The last overbought period ended with August 21st’s fakeout. It lasted five days and produced a slight gain. On the next day, I immediately loaded up a first tranche of puts on SSO when the index went lower. Technically, I should have waited until the close, but I was also wary that the index could sell-off sharply. I completely neglected to take into consideration the release of the minutes of the last Federal Reserve meeting. The “excitement” over that release was enough to keep a flat close on the S&P 500. The true follow-through selling occurred today with a 0.8% loss. (See “Federal Reserve Minutes Renew Pressure On Japanese Yen” for more of my thoughts on implications).
For now, trading is easier for the bears. The HUGE onus is on the buyers to prove that the market’s rally still has steam. Until buying momentum returns, I think the index is susceptible to a swift, multi-day sell-off at any time. Bears have an easy stopping point which is a fresh CLOSE above the intra-day high from two days ago. Until that happens, AND the index follows through, the bias is to fade rallies, especially at natural resistance.
Having said that, recall that the intermediate-term bias remains bullish until the S&P 500 manages to print a lower low. That has not happened since the June lows.
Daily T2108 vs the S&P 500
Click chart for extended view with S&P 500 fully scaled vertically (updated at least once a week)

Black line: T2108 (measured on the right); Green line: S&P 500 (for comparative purposes)
Weekly T2108

*All charts created using freestockcharts.com unless otherwise stated
Related links:
The T2108 Resource Page
Expanded daily chart of T2108 versus the S&P 500
Expanded weekly chart of T2108
Be careful out there!
Full disclosure: long SSO puts
