(T2108 measures the percentage of stocks trading above their respective 40-day moving averages [DMAs]. To learn more about it, see my T2108 Resource Page. You can follow real-time T2108 commentary on twitter using the #T2108 hashtag. T2108-related trades and other trades are posted on twitter using the #120trade hashtag)
T2108 Status: 74.5% (sixth day of FOURTH overbought period since June 29)
VIX Status: 14.7
General (Short-term) Trading Call: Finish accumulating bearish positions. Stop out and/or buy the dips after S&P 500 prints a new 52-week (and multi-year) high.
Reference Charts (click for view of last 6 months from Stockcharts.com):
S&P 500 or SPY
SDS (ProShares UltraShort S&P500)
U.S. Dollar Index (volatility index)
VIX (volatility index)
VXX (iPath S&P 500 VIX Short-Term Futures ETN)
EWG (iShares MSCI Germany Index Fund)
CAT (Caterpillar)
Commentary
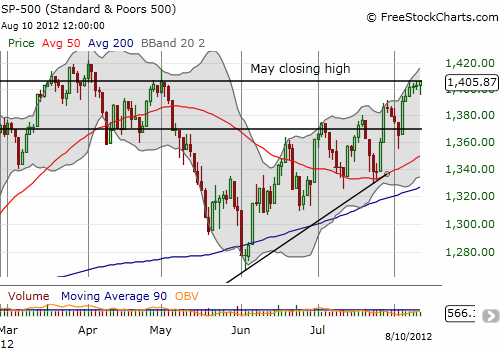
The market is right at a critical juncture of promise versus peril. T2108 remained essentially flat for most of the week in overbought territory. While the market made most of its 1.1% gain on the week on Tuesday’s rally, what is even more important is that the sellers and bears could not control the market. The market consistently rallied off its lows of the day. The last three days in particular demonstrated this resilience. This bunching has occurred directly under the next critical resistance: the May 1st closing high.

Think of this pattern as a build-up of pressure underneath resistance. As sellers continue to fail to send the index into its next sell-off, the buyers gain more confidence…and that confidence, at some point, leads to enough power to punch through resistance.
This chart also shows that the S&P 500’s behavior is slightly different than last four times the index has bounced from a higher low to a higher high. The current rally should have already given up a down day, and probably even a steep sell-off. The last low printed well above the previous lows. To me, all these signals suggest even more strongly that the bulls may subtly be taking over the S&P 500.
Finally, we need to respect the market’s ability to get to the other side of earnings season at its highest level since the May, 2012 high. Whatever conclusion one draws from the actual numbers, the price action of the S&P 500 indicates trades have already looked past those results to some greener pastures or concluded, all things considered, earnings came out OK.
That is the promise.
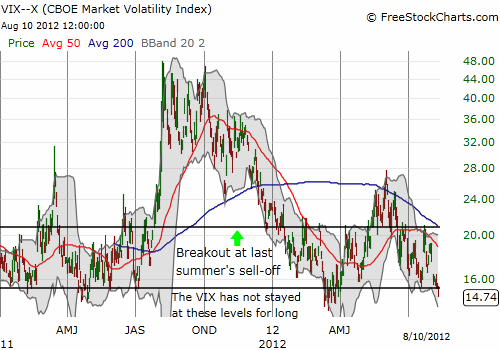
The peril lies in the overbought reading itself right at resistance. This position is a classic set-up for a short. Moreover, trading volume consistently fell to very low levels as the week progressed. It seems that the odds should favor a fresh sell-off at least to support (at the May, 2011 closing high). The VIX is also at surprisingly low levels, bordering on tremendous complacency in the face of some very real market headwinds. Since 2011, these levels have always been followed by some kind of volatility-generating sell-off. The closing low for this year is 14.03. The VIX is now at 14.74. I will be watching the market’s reaction VERY closely if (once?) the low gets retested.

At this point, I am sticking to the T2108 rules which dictate getting bearish under the current conditions. In addition to SSO puts, I bought puts on Siemens (SI), and even bought ProShares UltraShort MSCI Europe (EPV). I will be holding all these positions until either I can profit from a sell-off or a major breakout to fresh multi-year highs on the S&P 500. If that breakout happens, you can look for me to make the final transition to bullish trading by focusing exclusively on buying the dips (but selling the rips). Stay tuned!
Daily T2108 vs the S&P 500
Click chart for extended view with S&P 500 fully scaled vertically (updated at least once a week)

Black line: T2108 (measured on the right); Green line: S&P 500 (for comparative purposes)
Weekly T2108

*All charts created using freestockcharts.com unless otherwise stated
Related links:
The T2108 Resource Page
Expanded daily chart of T2108 versus the S&P 500
Expanded weekly chart of T2108
Be careful out there!
Full disclosure: long SDS; long SSO puts; long VXX shares, calls, and puts; short VXX calls; short AUD/USD
