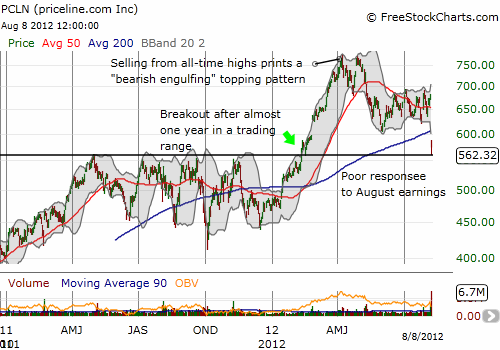
Wednesday was a rough day for priceline.com (PCLN). The company significantly pulled back current quarter revenue and earnings guidance based on expectations for poor performance in Europe. Europe represents 60% of PCLN’s revenues. It is a wonder that Europe is only just now dragging down results. In fact, PCLN spent almost three months of this year hitting all-time highs. Perhaps the recession in Europe first drove travelers to cheap options like PCLN and now they are simply not traveling at all.
Anyway, PCLN’s 17% drop in response to the poor earnings report gapped the stock down below its 200-day moving average (DMA). Even more importantly, at the lows, PCLN traded down to critical support at $560. This support represents the point where PCLN broke out on February 13, 2012 to fresh all-time highs. This breakout pushed PCLN above a wide trading range that had held for much of 2011.

Source: FreeStockCharts.com
Before PCLN’s May earnings report, I projected selling in response to the earnings report. PCLN never quite recovered as the trading range show above kept topping out right where the losses began after the last earnings report. That behavior alone was bearish. Now, the stock faces a critical bear versus bull test. A close below $560 suggests more losses to come. A bounce from current levels suggests at minimum a dead cat type of bounce back to the 200DMA around $605.
Be careful out there!
Full disclosure: no positions
