(T2108 measures the percentage of stocks trading above their respective 40-day moving averages [DMAs]. To learn more about it, see my T2108 Resource Page. You can follow real-time T2108 commentary on twitter using the #T2108 hashtag. T2108-related trades and other trades are posted on twitter using the #120trade hashtag)
T2108 Status: 59.9% (ends last overbought period at 6 days)
VIX Status: 18.6 (up 14.4% but once again rejected at its 50DMA)
General (Short-term) Trading Call: Hold (should have closed some bearish positions).
Reference Charts (click for view of last 6 months from Stockcharts.com):
S&P 500 or SPY
SDS (ProShares UltraShort S&P500)
U.S. Dollar Index (volatility index)
VIX (volatility index)
VXX (iPath S&P 500 VIX Short-Term Futures ETN)
EWG (iShares MSCI Germany Index Fund)
CAT (Caterpillar)
Commentary
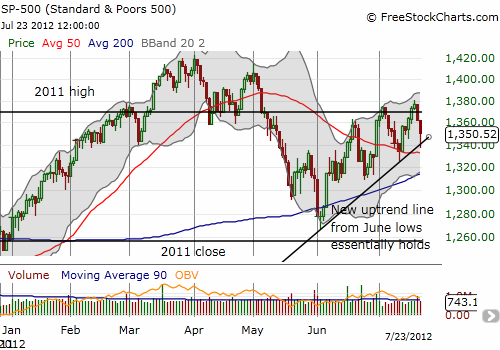
T2108 plunged to 59.9% from 70.9% ending a 6-day overbought period. This was the second “perfect” overbought period in a row in that it featured a rally into resistance that provided a profitable opportunity to fade the S&P 500. The index was down as much as 1.7% or so before two waves of buying took the index to a -0.9% close. This bounce was enough to save the S&P 500 from closing below the uptrend line from the June lows. Such a failure would have been a major technical event.

In the last T2108 Update, I recommended closing out bearish positions on further weakness in the S&P 500. I wasted no time after the open closing out my short on SPY and puts on SSO. In my tweets I incorrectly indicated I closed out half of my SSO puts; it was actually 1/3. In retrospect, I probably should have closed them all out. I also closed out various shorts in individual stocks.
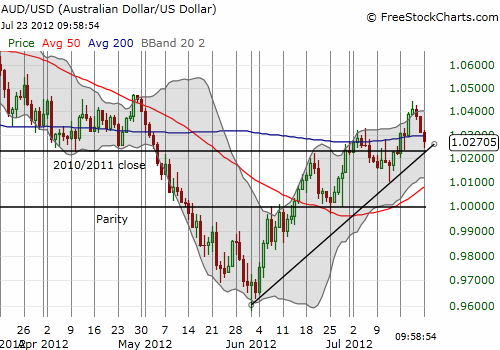
The Australian dollar (FXA) continued to provide an excellent leading indicator for the S&P 500. Soon after the open, I tweeted the following:
“Australian dollar still lagging poor technicals on $SPY. Has not yet broken its uptrend from June low on $AUDUSD. Watching for confirmation.”
Sure enough, the Australian dollar never broke its uptrend for June, delivering the tell for anyone paying attention that the S&P 500 was very likely to bounce.

Moreover, the Australian dollar held support at the 2010/2011 closing price against the U.S. dollar.
The VIX provided another handy signal although I was not watching it at the time. The VIX rallied right into its 50DMA and hit a brick wall. For the rest of the day, it slowly faded away from this resistance. In other words, when the VIX stopped increasing right at resistance, traders got a signal to at least close out short-term bearish positions.
Overall, technicals are working out exceptionally well to time trades. At some point, one or more of these signals will fail, but until then, we need to use them to maximum advantage while they last.
Finally, I added more shares to my contrarian play in Siemens Atkins (SI). It broke below its 50DMA and the support line from 2010. I am still targeting recent lows to hold against the tide of europanic.
Daily T2108 vs the S&P 500
Click chart for extended view with S&P 500 fully scaled vertically (updated at least once a week)

Black line: T2108 (measured on the right); Green line: S&P 500 (for comparative purposes)
Weekly T2108

*All charts created using freestockcharts.com unless otherwise stated
Related links:
The T2108 Resource Page
Expanded daily chart of T2108 versus the S&P 500
Expanded weekly chart of T2108
Be careful out there!
Full disclosure: long SDS; long VXX shares; short VXX call spreads; long VXX puts, long SSO puts, long SI
