(T2108 measures the percentage of stocks trading above their respective 40-day moving averages [DMAs]. To learn more about it, see my T2108 Resource Page. You can follow real-time T2108 commentary on twitter using the #T2108 hashtag. T2108-related trades and other trades are posted on twitter using the #120trade hashtag)
T2108 Status: 70.9% (6th overbought day)
VIX Status: 16.3 (essentially matches lowest level in over 2 months)
General (Short-term) Trading Call: Hold.
Reference Charts (click for view of last 6 months from Stockcharts.com):
S&P 500 or SPY
SDS (ProShares UltraShort S&P500)
U.S. Dollar Index (volatility index)
VIX (volatility index)
VXX (iPath S&P 500 VIX Short-Term Futures ETN)
EWG (iShares MSCI Germany Index Fund)
CAT (Caterpillar)
Commentary
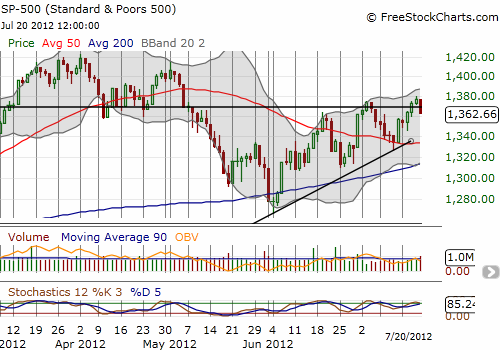
T2108 fell back to the edge of overbought territory as the S&P 500 fell 1% in a rejection from breakout territory. The S&P 500 is now sitting below resistance again (marked by the 2011 highs). Note in the chart below that stochastics are also overbought now. It seems the breakout will not get confirmed until the S&P 500 cools off a bit – perhaps to the uptrend from the June lows or the 50DMA…

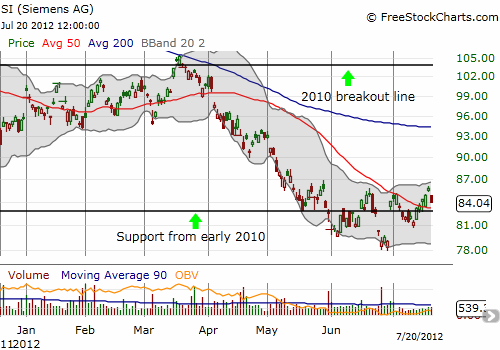
Given the current action, it is still not yet time to turn from a bearish to a bullish overbought trading strategy. However, if you accumulated a bearish position at resistance as recommended in the last T2108 update, you should take profits upon further weakness. One small exception I made was to purchase a small number of shares in Siemens Atkins (SI), my favorite contrary play on europanic. SI continues to struggle to break away from the support that held up from 2010 to this year. For two months the stock has churned around this line. With the stock pulling back on Friday back toward 50DMA support, I decided to go into accumulation mode in anticipation of an eventual breakout. The stop is below 2012 lows.

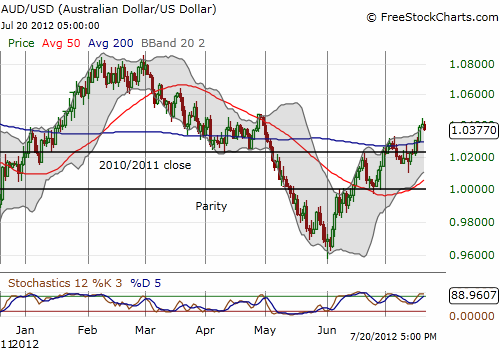
Finally, in a relationship I am watching ever more closely, the Australian dollar pulled back as I would expect given the weakness in the S&P 500. Note well that the Australian dollar remains in breakout mode against the U.S. dollar. This sets up a bullish divergence assuming that the Australian dollar will continue to lead the performance of the S&P 500. Overbought stochastics mean that the Australian dollar should experience further weakness. For the short-term, I am targeting a pullback to the 200DMA or the 2010/2011 close.

For more on details on the correlations between the Australian dollar and the S&P 500 see “Correlations Are Broken But Australian Dollar Still Leads The S&P 500” and/or “How Divergences Between The Australian Dollar And The S&P 500 Can Signal Trades.”
Daily T2108 vs the S&P 500
Click chart for extended view with S&P 500 fully scaled vertically (updated at least once a week)

Black line: T2108 (measured on the right); Green line: S&P 500 (for comparative purposes)
Weekly T2108

*All charts created using freestockcharts.com unless otherwise stated
Related links:
The T2108 Resource Page
Expanded daily chart of T2108 versus the S&P 500
Expanded weekly chart of T2108
Be careful out there!
Full disclosure: long SDS; long VXX shares; short VXX call spreads; long VXX puts, long SSO puts
