(T2108 measures the percentage of stocks trading above their respective 40-day moving averages [DMAs]. To learn more about it, see my T2108 Resource Page. You can follow real-time T2108 commentary on twitter using the #T2108 hashtag. T2108-related trades and other trades are posted on twitter using the #120trade hashtag)
T2108 Status: 76.3% (4th overbought day)
VIX Status: 16.2 (essentially matches lowest level in over 2 months)
General (Short-term) Trading Call: Add fresh bearish trade or accumulate bearish position one last time – otherwise hold.
Reference Charts (click for view of last 6 months from Stockcharts.com):
S&P 500 or SPY
SDS (ProShares UltraShort S&P500)
U.S. Dollar Index (volatility index)
VIX (volatility index)
VXX (iPath S&P 500 VIX Short-Term Futures ETN)
EWG (iShares MSCI Germany Index Fund)
CAT (Caterpillar)
Commentary
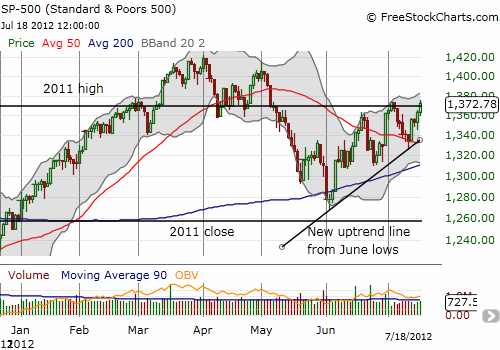
The S&P 500 is stubbornly crawling upward. Since bouncing off its 50DMA, the S&P 500 is up three out of the last four days. The index has closed above resistance at the 2011 highs and is retesting the July highs. A close above this resistance sets the stage for an extended overbought rally, the long anticipated follow-through to the blockbuster overbought rally that launched 2012.

T2108 is equal to 76.3%, the fourth overbought day in a row and the historical median duration of overbought periods (the average is 9.2 days). I decided to add to my SSO puts one last time given my earlier rule to only add to the position once the S&P 500 reaches critical resistance. I will consider this trade a bust on a breakout, and, just as in March, I will switch to a different overbought bullish strategy that emphasizes buying (intraday) dips and flipping fast.
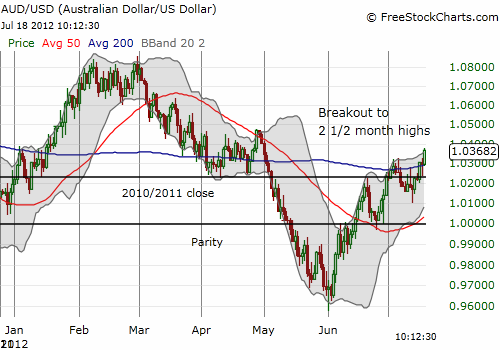
Finally, the Australian dollar continues to confirm the rally in the S&P 500. It too broke out, reaching 2 1/2 month highs against the U.S. dollar.

While I am extremely skeptical of the sustainability of gains for the Australian dollar, I will be forced to drop my bearish bias if the currency maintains follow-through from here. I am now more interested than ever in the correlation between the S&P 500 and the Australian dollar, especially since Australia’s biggest customer, China, is supposed to be experiencing a significant slowdown in growth.
For more on details on the correlations between the Australian dollar and the S&P 500 see “Correlations Are Broken But Australian Dollar Still Leads The S&P 500” and/or “How Divergences Between The Australian Dollar And The S&P 500 Can Signal Trades.”
Daily T2108 vs the S&P 500
Click chart for extended view with S&P 500 fully scaled vertically (updated at least once a week)

Black line: T2108 (measured on the right); Green line: S&P 500 (for comparative purposes)
Weekly T2108

*All charts created using freestockcharts.com unless otherwise stated
Related links:
The T2108 Resource Page
Expanded daily chart of T2108 versus the S&P 500
Expanded weekly chart of T2108
Be careful out there!
Full disclosure: long SDS; long VXX shares; short VXX call spreads; long VXX puts, long SSO puts
