(T2108 measures the percentage of stocks trading above their respective 40-day moving averages [DMAs]. To learn more about it, see my T2108 Resource Page. You can follow real-time T2108 commentary on twitter using the #T2108 hashtag. T2108-related trades and other trades are posted on twitter using the #120trade hashtag)
T2108 Status: 74.1% (1st overbought day following a day break from an 8-day overbought period)
VIX Status: 16.7 (essentially matches lowest level in over 2 months)
General (Short-term) Trading Call: Continue selling bullish trades, open fresh bearish trades (only accumulate at resistance) – watch out for earnings-related volatility.
Reference Charts (click for view of last 6 months from Stockcharts.com):
S&P 500 or SPY
SDS (ProShares UltraShort S&P500)
U.S. Dollar Index (volatility index)
VIX (volatility index)
VXX (iPath S&P 500 VIX Short-Term Futures ETN)
EWG (iShares MSCI Germany Index Fund)
CAT (Caterpillar)
Commentary
On Wednesday, July 11th, I wrote that the S&P 500 was poised for a bounce off its 50DMA and the uptrend from the June lows. I also wrote that I planned to fade such a bounce. However, the bounce took one more day than expected and along the way T2108 dropped out of overbought conditions, producing a false breakdown below the 50DMA.
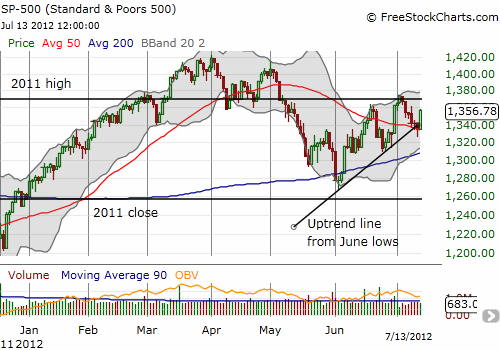
On Thursday, July 12th, T2108 dropped to 65.7%, ending the previous overbought period at 8 days. This period fell just one day short of the average duration of 9 days (median is 4 days). This was a nearly picture perfect overbought period. It provided a few opportunities to fade rallies even as the S&P 500 sold off the last 5 days of the overbought period. The S&P 500 quickly bounced back with a very strong 1.7% jump on Friday, July 13th that took T2108 right back into overbought territory at 74.1%. This rally completed a 3-day test of the 50DMA support. On Thursday, the index actually broke through this support only to rally back and close right on top of the 50DMA (once again, you just can’t make this stuff up!). While the closing rally was impressive (and perhaps a signal of what was to follow on Friday!), it took Friday’s rally to reposition the S&P 500 above the uptrend line from June lows. The chart below summarizes the action:

At 16.7 the VIX is now essentially at its lowest close in 2 1/2 months. So much for fear of a global economic slowdown and/or a blow-up in Europe!
Given earnings season has started, the path forward will be treacherous for bulls and bears. As I have mentioned before, it seems that companies with notable business exposed to the global economy, especially Europe and China, are going to continue disappointing the market. I still expect the power of this disappointment to dissipate as earnings season wears on. If the S&P 500 remains above its 50DMA, or even its 200DMA, through all this, the bulls will score a major victory (no matter where T2108 happens to be at the time).
I will continue to follow the T2108 rules which now tell me to initiate fresh bearish positions (I bought SSO puts on Friday). I will only grow this position if the S&P 500 trades higher into resistance at the 2011 high (see chart above). This strategy worked wonders last time, so I am very wary of “something different” occurring this time. A break above resistance will force me to re-evaluate my strategy given a breakout above resistance would produce another higher high following two higher lows – a very bullish sign.
Daily T2108 vs the S&P 500
Click chart for extended view with S&P 500 fully scaled vertically (updated at least once a week)

Black line: T2108 (measured on the right); Green line: S&P 500 (for comparative purposes)
Weekly T2108

*All charts created using freestockcharts.com unless otherwise stated
Related links:
The T2108 Resource Page
Expanded daily chart of T2108 versus the S&P 500
Expanded weekly chart of T2108
Be careful out there!
Full disclosure: long SDS; long VXX shares; short VXX call spreads; long VXX puts, long SSO puts
