(This is an excerpt from an article I originally published on Seeking Alpha on July 8, 2012. Click here to read the entire piece.)
I have written several articles now discussing the dynamics of the Australian dollar as well as its correlation with the S&P 500 (SPY). At the end of May, I wrote “Correlations Are Broken But Australian Dollar Still Leads The S&P 500” and demonstrated how the decline in the Australian dollar versus the U.S. dollar (FXA) in March potentially provided a leading indicator of the eventual peak of the year for the S&P 500. Friday’s trading showed once again how traders might be able to use divergences between the Australian dollar and the S&P 500 to guide short-term trading.
{snip}

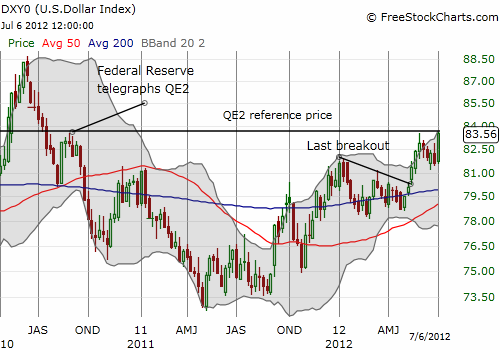
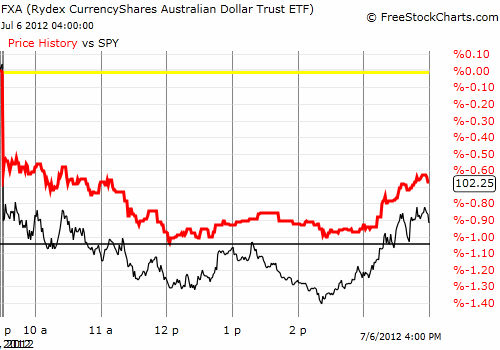
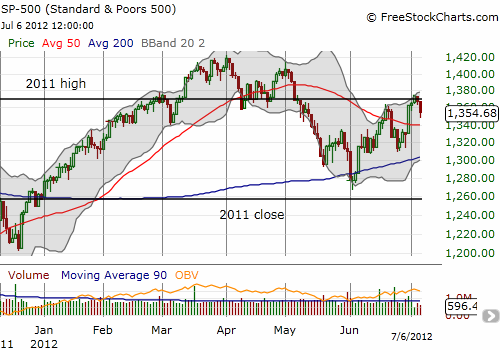
Although the U.S. dollar index remained strong into the close, the Australian dollar rallied strongly into the close. In fact, while the S&P 500 made a new low for the day ahead of 2:30pm, the Australian dollar (against the U.S. dollar) did not. This divergence, a bullish divergence, may have served the attentive trader well on Friday no matter what explains the closing rally. Going forward, I am certainly going to monitor weekly, daily, AND intra-day divergences between the Australian dollar and the S&P 500. In the chart below, the thick red line represents the Australian dollar versus the U.S. dollar in foreign exchange (AUD/USD) and the black (jagged) line represents the S&P 500. The black horizontal line represents the Australian dollar’s low for the day.

{snip}

Source for charts: FreeStockCharts.com
Be careful out there!
(This is an excerpt from an article I originally published on Seeking Alpha on July 8, 2012. Click here to read the entire piece.)
Full disclosure: net short Australian dollar, long SDS
