Cyclical stocks continue to worry me even as the S&P 500 treads water. Charts across a wide swath of related stocks show inabilities to break critical resistance and in some cases, are outright breaking down. Here are several representative charts along with brief commentary.
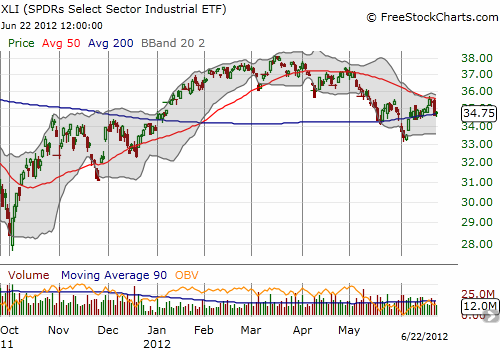
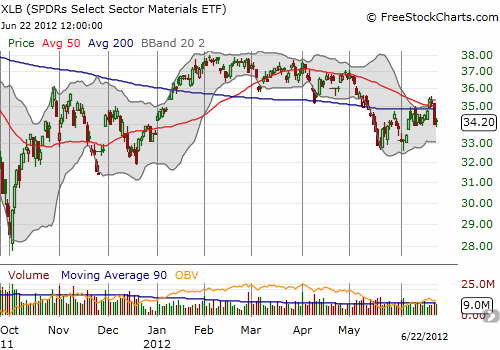
The Materials Select Sector SPDR (XLB) and the Industrial Select Sector SPDR (XLI) both failed at 50-day moving averages (DMAs) last week. XLB is below its 200DMA again and is back in very bearish territory.
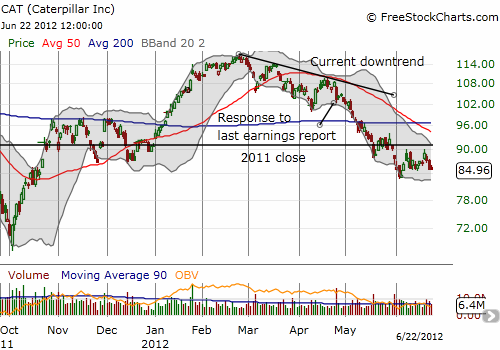
Caterpillar, Inc. (CAT) failed to benefit much from the stock market’s raly through last Thursday’s sell-off. It remains negative for the year and looks ready for a fresh round of selling.
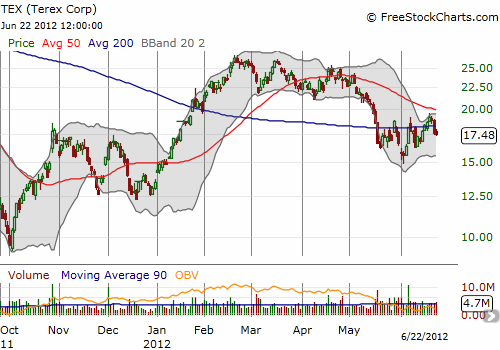
CAT cousin Terex (TEX) is below its 200DMA again. The declining 50DMA will likely form an ever tighter ceiling.
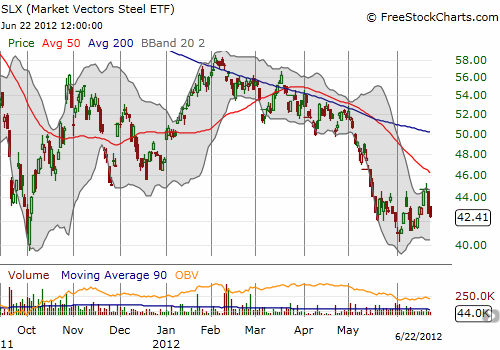
Many steel stocks have cratered again in 2012. The Market Vectors Steel ETF (SLX) already retested 2011 lows and failed to gain enough momentum to pull away from a new breakdown.
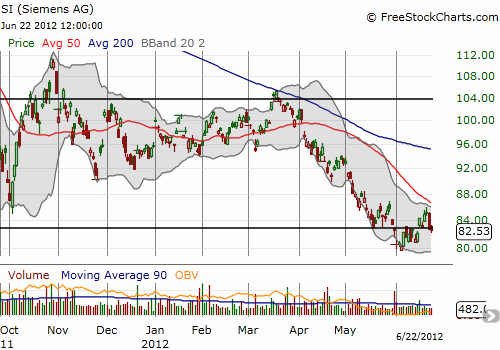
The recent rally in Siemens AG (SI) off 2012 lows stalled right under its 50DMA. The stock is now trading back at critical support that has held since 2010.
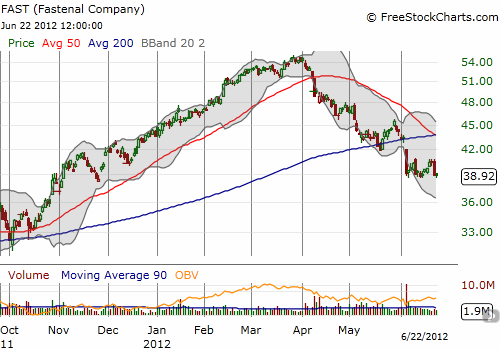
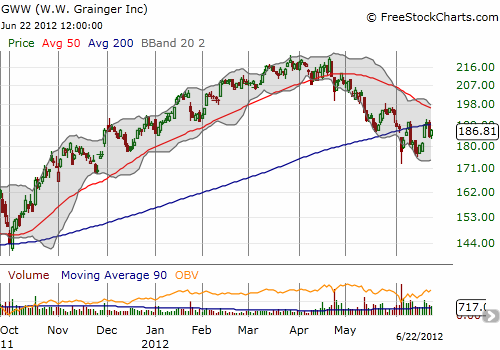
Fastenal Company (FAST) and fellow parts supplier W.W. Grainger, Inc. (GWW) continue the malaise I pointed out in “Rich Valuations Mean Fastenal Has Likely Peaked Short-Term, Buy On Lower Prices.”
FAST is right back to critical support from the lows of the year. It seems almost sure to continue it sell-off.
Although GWW’s 200DMA continues to rise, the stock also continues to fail at that resistance level.
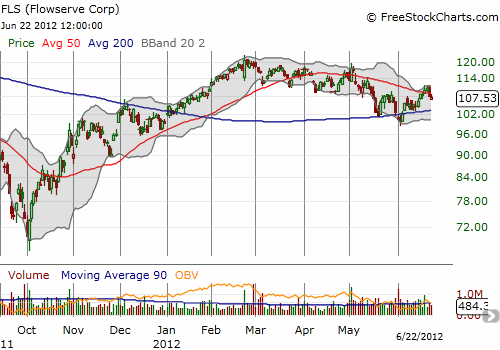
Flowserve (FLS) remains a relative bright spot although its stock has trended down since hitting a 2012 peak in February. FLS is sstruggling to break free of a declining 50DMA. Another break below the 200DMA will likely ignite a fresh sell-off.
Source for charts: FreeStockCharts.com
Whether trading off recent highs or recent lows, all these stocks are warning of future economic weakness. I strongly suspect July will deliver some very ominous earnings warnings that will reinforce the poor technical patterns developing here. This group, and many others, is in high need of a very positive catalyst…and soon.
Be careful out there!
Full disclosure: long CAT; long SI calls; long TEX puts; long SDS and SSO
