(T2108 measures the percentage of stocks trading above their respective 40-day moving averages [DMAs]. To learn more about it, see my T2108 Resource Page. You can follow real-time T2108 commentary on twitter using the #T2108 hashtag. T2108-related trades and other trades are posted on twitter using the #120trade hashtag)
T2108 Status: 37%
VIX Status: 18.3 (a close below the critical 21 level!)
General (Short-term) Trading Call: Hold
Reference Charts (click for view of last 6 months from Stockcharts.com):
S&P 500 or SPY
SDS (ProShares UltraShort S&P500)
U.S. Dollar Index (volatility index)
VIX (volatility index)
VXX (iPath S&P 500 VIX Short-Term Futures ETN)
EWG (iShares MSCI Germany Index Fund)
CAT (Caterpillar)
Commentary
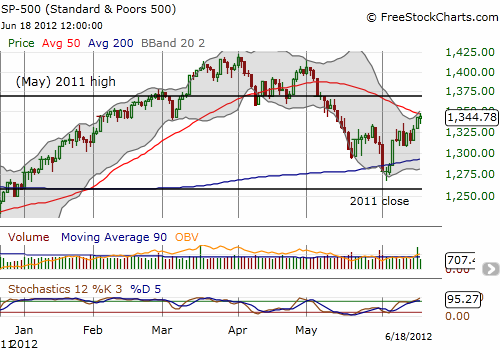
T2108 jumped to 37%. The VIX got crushed with an 8% loss and is now BELOW the critical 21 support. The euro lost all its early gains (and then some) against major currencies. The Australian dollar closed the U.S. trading session at new five week highs and surged into the U.S. trading close. The Nikkei started global trading for the week with a 2% open. Amidst all the confusion, the S&P 500 managed to go nowhere, barely scraping out a 2-point gain. With its failure to close above its 50DMA, I still cannot quite get bullish.

Adding to the cloudy cocktail of signals, stochastics on the S&P 500 are extremely overbought. The last time stochastics were at current levels, the S&P 500 began its May swoon. I have concluded that either the index is about suffer another correction, likely to retest the 200DMA, OR it is in the early stages of a major rally. Note that 2012 began with stochastics at similar levels and remained there for most of the subsequent rally. Stochastics are oscillators and do not communicate new information when the market embarks on an extended trend. T2108 is also similar to an oscillator, but my previous analyses of the indicator have uncovered specific points where T2108 can communicate new information even in the midst of trends. Anyway, the binary outcome I am anticipating makes trading particularly precarious. So, the trading call stays on hold until some more clarity appears.
Daily T2108 vs the S&P 500

Black line: T2108 (measured on the right); Green line: S&P 500 (for comparative purposes)
Weekly T2108

*All charts created using freestockcharts.com unless otherwise stated
Related links:
The T2108 Resource Page
Expanded daily chart of T2108 versus the S&P 500
Expanded weekly chart of T2108
Be careful out there!
Full disclosure: long SDS, long VXX calls and shares, net short euro and Australian dollar
