(T2108 measures the percentage of stocks trading above their respective 40-day moving averages [DMAs]. To learn more about it, see my T2108 Resource Page. You can follow real-time T2108 commentary on twitter using the #T2108 hashtag. T2108-related trades and other trades are posted on twitter using the #120trade hashtag)
T2108 Status: 33.5%
VIX Status: 21.1
General (Short-term) Trading Call: Hold
Reference Charts (click for view of last 6 months from Stockcharts.com):
S&P 500 or SPY
SDS (ProShares UltraShort S&P500)
U.S. Dollar Index (volatility index)
VIX (volatility index)
VXX (iPath S&P 500 VIX Short-Term Futures ETN)
EWG (iShares MSCI Germany Index Fund)
CAT (Caterpillar)
Commentary
The Greek elections are over, and Europe is still standing. Financial markets remain hinged, and there is likely no need for global central banks to step in and coordinate any interventions (not yet anyway). Now, I can get back to the technicals for the T2108 Update.
Friday’s rally was strong and impressive. It was a day the markets had every reason to cower and retreat and instead the shorts and sellers were scrambling to get out of the way. T2108 closed at its highest point in over a month. It closed above its 50DMA but a similar breakout at the end of April only preceded a major May sell-off. Moreover, T2108 remains in a downtrend, so T2108 cannot tell us a lot right now except that the bounce from the previous oversold period remains alive and well.
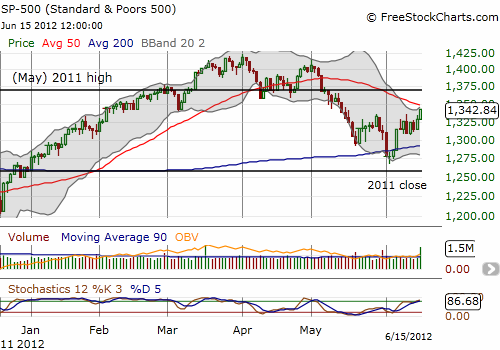
The S&P 500 broke through resistance from the bounce from May’s oversold period and closed at the highs of the day. The 50DMA remains directly above as the next point of strong resistance. Volume surged but was likely impacted by triple-witching expiration. Note in the chart below that the S&P 500’s stochastics are overbought.

Finally, the VIX stubbornly refused to close below the critical 21 level but is just a breath away from such a bullish close.
In other words we have all the ingredients of an important juncture in the market. Either the VIX will hold its ground and continue to scream out its alarm, or the S&P 500 will fight its way through another resistance level and put an official end to the malaise of May.
For Monday, I will be looking out for a “gap and crap” where the index hurdles over the 50DMA only to fade back under it. However, once the S&P 500 closes above this resistance, I adopt a much more bullish bias until at least the next T2108 overbought reading. Note well that history (before 2008) tells us that the majority of summer months feature trading where the highs of May get retested and beaten. So, if the S&P 500 swings bullish, an ultimate short-term target will be the May 1st high, next a retest of 52-week highs and then perhaps even new 52-week (and multi-year) highs.
So far, so good for the euro as it pops against all major currencies….except the Swiss franc. Yes, the fat franc still refuses to fly.
Black line: T2108 (measured on the right); Green line: S&P 500 (for comparative purposes)
Weekly T2108

*All charts created using freestockcharts.com unless otherwise stated
Related links:
The T2108 Resource Page
Expanded daily chart of T2108 versus the S&P 500
Expanded weekly chart of T2108
Be careful out there!
Full disclosure: long SDS, long VXX calls and shares, long EUR/CHF

