(T2108 measures the percentage of stocks trading above their respective 40-day moving averages [DMAs]. To learn more about it, see my T2108 Resource Page. You can follow real-time T2108 commentary on twitter using the #T2108 hashtag. T2108-related trades and other trades are posted on twitter using the #120trade hashtag)
T2108 Status: 18.6% (Day #1 of oversold period)
VIX Status: 26.7
General (Short-term) Trading Call: Cover some shorts, start building bullish trading positions (click here for a trading summary posted on twitter)
Reference Charts (click for view of last 6 months from Stockcharts.com):
S&P 500 or SPY
SDS (ProShares UltraShort S&P500)
U.S. Dollar Index (volatility index)
VIX (volatility index)
VXX (iPath S&P 500 VIX Short-Term Futures ETN)
EWG (iShares MSCI Germany Index Fund)
CAT (Caterpillar)
Commentary
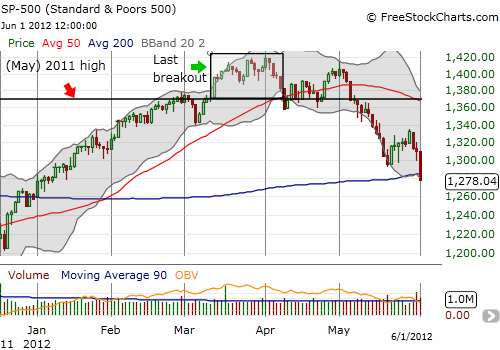
As I feared, the bounce from oversold conditions did not last long. The selling surge at the end of Thursday did indeed indicate sellers had “unfinished business.” The S&P 500 lost 2.5% and sent T2108 plunging back into oversold conditions after about a week respite from the last oversold period. This plunge was about as ugly as they get as the index broke cleanly through 200DMA support and closed at the day’s lows.

The S&P 500 is now only up 1.6% for the year after having gained as much as 12%. Naturally, any casual observer is left wondering what all that excitement was about in the first place. It took three months to build those gains and about two months to tear them back down. Such a roller coaster will stoke pessimism and give plenty of motivation for investors to avoid the market and traders to short it. Breaks of the 200DMA in each of the last two years have preceded sharp sell-offs and large losses before bottoms formed. So why bother building longs in this oversold period? Well, first and foremost, I think bears will overplay their hand, get too aggressive, and sew the seeds of sharp counter-trend rallies. Secondly, the overall trend in the S&P 500 remains up. 2011’s bottom was higher than 2010’s bottom. Each year since the March, 2009 lows has delivered higher highs. Unfortunately, the rally that started this year barely rested, so no natural support exists until the lows from December and then November, 1200 and 1160 respectively. In other words, the downside risks are real.
I was fortunate that my orders for SSO calls on Thursday never filled. It saved me powder for buying them on Friday. Friday’s ugly opening pretty much guaranteed a visit to oversold territory so I acted accordingly. I ended up buying two tranches of SSO calls. These will get dutifully sold into the next rally. With the 200DMA getting violated, I am not too optimistic for this tranche. If the sell-off deepens, I will pick one more spot for July calls and after that I switch to SSO shares in order to provide more room for patience in this oversold period. In the meantime, I still hold my long-standing SDS shares. After the strength and length of the last overbought period, I assumed I would never see this position get back to even. Yet, it is almost there. This irony makes the losses I took fooling around with VXX shares sting even more – I have since switched to VXX options which force me to think of the trade as short-term and tightly cap any losses.
The overbought period that lasted the first two months of this year was historic. The seventh longest since 1986. It was an extreme event that threw off my standard strategies. Soon after it ended, I switched to an aggressively bullish short-term trading style given the historical record of extreme overbought periods preceding at least one more strong rally. This switch worked very well for almost two months. On May 4th, my T2108 Update was sub-titled “Topping Pattern Developing.” The S&P 500 failed to punch through to a new 52-week high and the seasonal danger of May seemed like all the warning we needed. Specifically, I said at the time:
“Traders must assume that the S&P 500 has now printed a lasting top. Such a top would be consistent with another scramble to sell in May (see my last “sell-in-May” analysis in “If You Must Sell In May, Choose The Start Or The End Of The Month“). Only fresh highs will break this latest bearish spell…my overall bias is now officially bearish. That is, I no longer expect a break to new 52-week (multi-year highs) anytime soon. While I have no downside target, I will be looking to fade rallies and aggressively trade against stocks retesting resistance levels or breaking critical support.”
I did not think bears would have it easy from that point, but they have. In retrospect, the 200DMA was the obvious downside target, but it was not until the last two weeks or so that I started to think the S&P 500 would retest it. Even as late as Friday morning, I did not think the 200DMA would break easily!
It turns out that this period of selling is also the worst performance of the S&P 500 following an extreme overbought period. I went back to my last analysis of overbought periods for some perspective. As I mentioned, this year’s extreme overbought period lasted 43 days – the seventh longest since 1986. The immediately subsequent period is reminiscent of the period following 2010’s 39-day overbought period (the 8th longest) where the market topped that May and sold off for the summer.
In thinking about what would follow this year’s extreme overbought period, I was entirely focused on the top six overbought periods. Even the extreme overbought period in 1987 (total of 59 days) was followed by another substantial rally that started with a breakout in June of all things. In just two months, the S&P 500 tacked on ANOTHER 12.5% before peaking in late August, ahead of the historic crash of 1987 in October. The 64-day overbought period in 1997 holds the record (since 1986). It ended in August, 1997, gave way to another short burst higher, and then another ugly October where the index lost over 10% from highs to lows. That sell-off did not erase the gains for 1997. Nine months later, the S&P 500 recovered with an incredible 41% gain that ended with a peak in July (again, of all things!). Even the crash of 1998 did not create lows for THAT year.
In other words, the record for trading in the immediate aftermath of an extreme overbought period is quite bullish. While I under-estimated the risks for a more serious sell-off this year, the historical record STILL tells us that over the course of time, the odds favor substantial gains. I want to position for that. I want to buy into the sell-off for this summer and/or the Fall. The first true danger sign will be a break of 2011’s lows: not only would this end the S&P 500’s upward trend, but it would also plunge the index into a technical bear market.
It will not be easy to prevent these multiple timeframes from creating conflicting trading strategies. So, I will try to keep things as simple as possible. For now, T2108 is oversold, and the trading rules tell us to get much less bearish and to get more bullish for the short-term. The break of the 200DMA tells us to maintain an overall bearish bias. The end result will be my preference to sell my latest SSO calls at the first opportunity. I will also maintain a preference for shorting individual stocks when they hit resistance levels or close below critical support levels on high selling volume. My bearish bias will remain in place until the S&P 500 can at least re-conquer the the minor high at 1335. I cannot consider dropping the bearish bias until the index reconquers its now declining 50DMA. THAT milestone will likely be a difficult one to achieve for this summer.
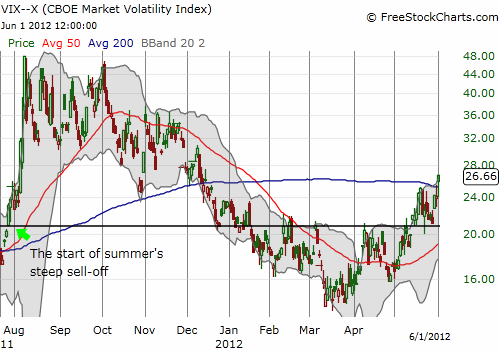
I end this long update with a look at the VIX. The volatility index will loom in the background as our final arbiter of bearish versus bullish feelings. Right now, it looks more bearish than ever. After successfully holding the critical 21 level, the VIX has now jumped over its 200DMA. I feel naked now without any VXX calls as a hedge! However, if the VIX spikes – say over 10% in a day – during an oversold period, I will assume a lasting bottom is at hand…and I will finally dump all my SDS shares.

(For anyone thinking about the potential of QE3 to “save the day”, please see my post on the precarious price of the U.S. dollar that could serve as one motivating factor for the Fed: “The U.S. Dollar’s Rally Ends (For Now?) At Its ‘QE2 Reference Price’“).
(Note – as of May 11, 2012, I am still trying to figure out how to make the S&P 500 overlay work better).
Black line: T2108 (measured on the right); Green line: S&P 500 (for comparative purposes)
Weekly T2108

*All charts created using freestockcharts.com unless otherwise stated
Related links:
The T2108 Resource Page
Expanded daily chart of T2108 versus the S&P 500
Expanded weekly chart of T2108
Be careful out there!
Full disclosure: long SDS, long SSO calls

