(T2108 measures the percentage of stocks trading above their respective 40-day moving averages [DMAs]. To learn more about it, see my T2108 Resource Page. You can follow real-time T2108 commentary on twitter using the #T2108 hashtag. T2108-related trades and other trades are posted on twitter using the #120trade hashtag)
T2108 Status: 24.4% (Last oversold period ends at 4 days)
VIX Status: 24.1
General (Short-term) Trading Call: Hold, make sure at least one hedge remains active (click here for a trading summary posted on twitter)
Reference Charts (click for view of last 6 months from Stockcharts.com):
S&P 500 or SPY
SDS (ProShares UltraShort S&P500)
U.S. Dollar Index (volatility index)
VIX (volatility index)
VXX (iPath S&P 500 VIX Short-Term Futures ETN)
EWG (iShares MSCI Germany Index Fund)
CAT (Caterpillar)
Commentary
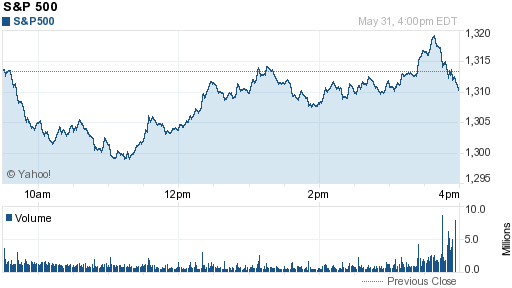
T2108 rose a little from 23.2% to 24.4%. The VIX, the volatility index, bounced perfectly away from its 200DMA resistance, ending the day flat. The S&P 500 lost as much as 1% before perfectly bouncing off the psychologically important 1300 level. I thought the lows likely marked a flip to oversold T2108 levels, until I looked at the intra-day action. Volume surged into the close as selling dominated the last 30 minutes. The intra-day chart shows how buying accelerated into 3:30pm and just as fast sellers took the index right back down.

Source: Yahoo!Finance
That selling tells me there is unfinished business to the downside – like a retest of the 200DMA around 1284 on the S&P 500. At the rate things are going that retest should happen with T2108 tripping oversold (and the VIX breaking through its 200DMA resistance!).
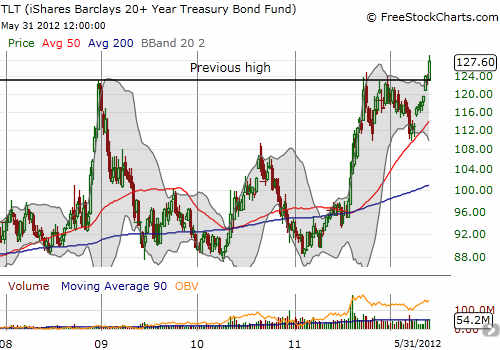
Note that the 6.2% drop in May for the S&P 500 is its fourth worst May performance since 1950. May, 2010 was one of the top three! On the other hand, TLT, the iShares Barclays 20+ Year Treasury Bond Fund (TLT), gained 8.8% on the month. It is at its highest level ever, surpassing even the levels from the financial panic in 2008/2009. This speaks volumes about the fear in the market, but it also helps to stretch the rubber band even further in support of an eventual sharp rebound.

Finally, in trading, I just missed a lowball offer on SSO calls near the lows of the day. I was hoping to have a play in hand in case we get the legendary first of the month rally on June 1st. I sold my VXX calls.
(Note – as of May 11, 2012, I am still trying to figure out how to make the S&P 500 overlay work better).
Black line: T2108 (measured on the right); Green line: S&P 500 (for comparative purposes)
Weekly T2108

*All charts created using freestockcharts.com unless otherwise stated
Related links:
The T2108 Resource Page
Expanded daily chart of T2108 versus the S&P 500
Expanded weekly chart of T2108
Be careful out there!
Full disclosure: long SDS

