(This is an excerpt from an article I originally published on Seeking Alpha on May 26, 2012. Click here to read the entire piece.)
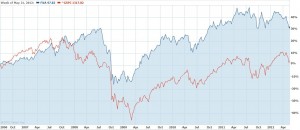
The Australian dollar…{snip}…has been highly correlated with the S&P 500 (SPY) for much of the last six years and more. The correlation has broken down at critical moments, the most interesting of which occurred with the Australian dollar emerging as a leading indicator.
The first important correlation breakdown since 2006 was in 2008 when commodity prices soared in a last gasp before the global economy plunged into recession. {snip} While the S&P 500 went on to make fresh multi-year lows in March, 2009, the Australian dollar never went lower. {snip}
The Australian dollar again served as a non-confirming signal when the S&P 500 made a 2010 low at the end of June and beginning of July, 2010 while the Australian dollar was already a month into its bounce from 2010 lows.
In 2011, things changed a bit. When the S&P 500 retested 2011 lows on October 1st, the Australian dollar dropped in sympathy. The two dropped together the next month as well.
{snip}
Click image for a larger view…

Source: Yahoo! Finance
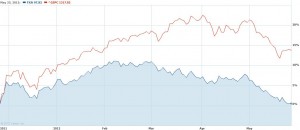
This year, the Australian dollar peaked during the month of February while the S&P 500 continued to rally. {snip} Taken together, the peak and subsequent sell-off in the Australian dollar served as a leading indicator of the peak and sell-off in the S&P 500.
Click the image for a larger view…

Source: Yahoo! Finance
So what now? It seems the odds favor the Australian dollar serving as a leading indicator again. {snip}…here are the scenarios I am actively monitoring for trading opportunities:
{snip}
{snip}
Be careful out there!
(This is an excerpt from an article I originally published on Seeking Alpha on May 26, 2012. Click here to read the entire piece.)
Full disclosure: long SDS, net long Australian dollar in forex
