(T2108 measures the percentage of stocks trading above their respective 40-day moving averages [DMAs]. To learn more about it, see my T2108 Resource Page. You can follow real-time T2108 commentary on twitter using the #T2108 hashtag. T2108-related trades and other trades are posted on twitter using the #120trade hashtag)
T2108 Status: 55%
VIX Status: 16.2%
General (Short-term) Trading Call: Hold with a bullish bias. (click here for a trading summary posted on twitter)
Reference Charts (click for view of last 6 months from Stockcharts.com):
S&P 500 or SPY
SDS (ProShares UltraShort S&P500)
U.S. Dollar Index (volatility index)
VIX (volatility index)
VXX (iPath S&P 500 VIX Short-Term Futures ETN)
EWG (iShares MSCI Germany Index Fund)
CAT (Caterpillar)
Commentary
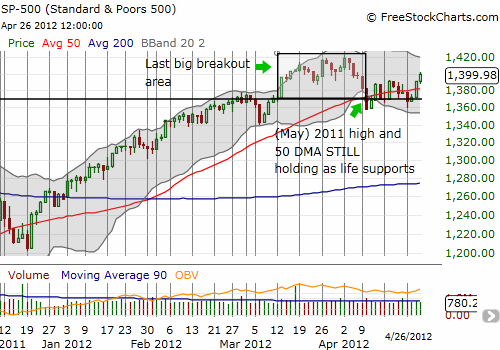
Momentum seems to be rebuilding for the market. T2108 has soared over the last two days and now sits at 55%. I tweeted yesterday that the T1208 at 47% broke the April downtrend and confirmed the gaining momentum indicated by the S&P 500’s strong rally day that punched through the 50DMA. Now, the index is at 3-week highs. The chart below also shows the firm support the index has experienced at the last breakout line (which also coincides with last year’s highs).

The volatility index is also dropping. It has confirmed resistance at 20 once again. Accordingly, VXX, the volatility ETN, has plunged and is right around the corner from fresh all-time lows.
On the trading side, I find myself disappointed by a lack of VXX puts and SSO calls. I did not replenish my VXX puts after last week’s April expiration, and only have one May VXX put on hand. I bought tentatively into Monday’s big sell-off with May SSO calls first and then a fortuitous execution near the lows of the day on weekly SSO calls. I sold all of them into Tuesday’s lift, thinking the momentum looked poor. Unfortunately, I did not recognize that the odds had shifted toward a retest of the highs from the recent churn up and down and around the critical breakout support line. Moreover, T2108 was at relatively attractive levels in the 30s. Even a day’s worth of additional patience would have generated a large amount of additional profit. Another lesson learned!
Going forward, I am anticipating T2108 to hit overbought conditions by sometime next week. This means my trading call shifts back to a bullish bias for now (note, I have not had a bearish bias since the major strategy change in early March). The stars seem well-aligned for May’s trading to start with T2108 overbought. Such an event will add one more reason for traders to sell in May. May will deliver a tumultuous mix of bearish technical signals from foreign exchange, macroeconomic weakness from Europe, and a T2108 history that suggests we should expect the rebuilding momentum to kick-off another sustained rally. I adjust my expectations, if needed, after I see how and where the S&P 500 trades once T2108 trips into overbought territory.
Black line: T2108 (measured on the right); Green line: S&P 500 (for comparative purposes)
Weekly T2108

*All charts created using freestockcharts.com unless otherwise stated
Related links:
The T2108 Resource Page
Expanded daily chart of T2108 versus the S&P 500
Expanded weekly chart of T2108
Be careful out there!
Full disclosure: long SDS; long VXX put

