(T2108 measures the percentage of stocks trading above their respective 40-day moving averages [DMAs]. To learn more about it, see my T2108 Resource Page. You can follow real-time T2108 commentary on twitter using the #T2108 hashtag. T2108-related trades and other trades are posted on twitter using the #120trade hashtag)
T2108 Status: 31%
VIX Status: 19.6%
General (Short-term) Trading Call: Hold. (click here for a trading summary posted on twitter)
Reference Charts (click for view of last 6 months from Stockcharts.com):
S&P 500 or SPY
SDS (ProShares UltraShort S&P500)
U.S. Dollar Index (volatility index)
VIX (volatility index)
VXX (iPath S&P 500 VIX Short-Term Futures ETN)
EWG (iShares MSCI Germany Index Fund)
CAT (Caterpillar)
Commentary
I was surprised to see T2108 jump from 28% to 31% today given the swoon in big cap tech stocks like Apple (AAPL) and Google (GOOG). I was starting to look forward to T2108 approaching oversold conditions again. But it turned out that technical stocks were relative underperformers.
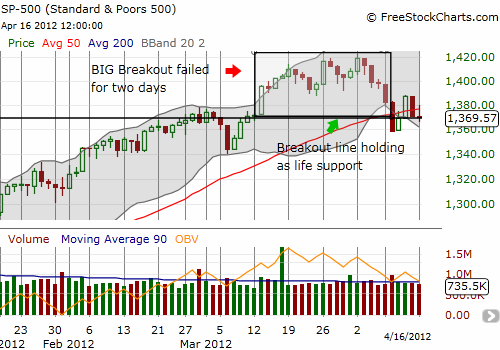
In another case of “you can’t make this stuff up,” the S&P 500 closed right on top of the breakout line for the third day out of four. Bulls are clinging to the reins of the market after losing the advantage they reclaimed with last Thursday’s impressive follow-through rally.

Volatility also completed its full recovery from the shellacking it took last Thursday although it closed off its highs. Here again the bulls failed to firmly re-establish their dominance over the action. On the other hand, the VIX has failed to re-establish itself above the launching point for last summer’s swoon.
Overall, it seems we keep getting confirming signals that we are in for an extended period of churn. Even if somehow we manage to get a third summer in a row of frightened selling (I wonder what the odds are), I have to guess that the market will find a way to climb out the hole again in due time. On the other side of such a swoon, we will once again wonder why the big commotion occurred in the first place.
Charts below are the latest snapshots of T2108 (and the S&P 500)
Refresh browser if the charts are the same as the last T2108 update.
Black line: T2108 (measured on the right); Green line: S&P 500 (for comparative purposes)
Weekly T2108

*All charts created using freestockcharts.com unless otherwise stated
Related links:
The T2108 Resource Page
Expanded daily chart of T2108 versus the S&P 500
Expanded weekly chart of T2108
Be careful out there!
Full disclosure: long SDS; long SSO calls; long VXX puts and calls; long AAPL call spread, long GOOG put spread, long QQQ calls

