(This is an excerpt from an article I originally published on Seeking Alpha on March 26, 2012. Click here to read the entire piece.)
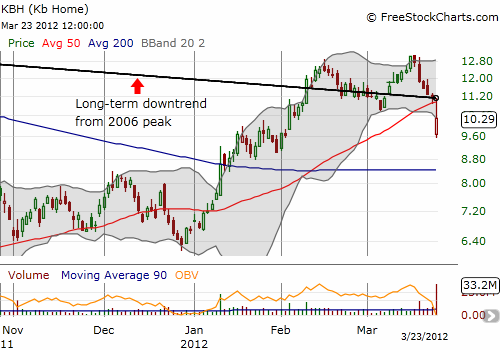
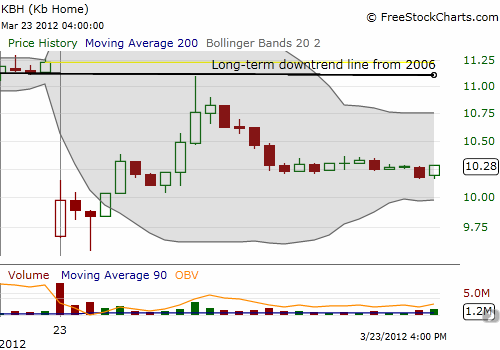
Despite an improving outlook for KB Home (KBH), the stock sold off post-earnings on Friday. KBH dropped 8.5% for the day after dropping as much as 15.0% and after closing the entire loss for the day at one point. Interestingly, the trading action took KBH below its 50-day moving average (DMA) and kept the stock directly under its long-term, multi-year downtrend (shown in my previous post “Bears Load Up Ahead of Earnings for KB Home“).


The lift from the lows occurred as the earnings conference call revealed that headlines about an 8% year-over-year decline in net orders (105 homes) masked very encouraging results and an outlook that continues to improve. {snip}
My continued longer-term optimism on KBH is based on reviewing the transcript of the earnings conference call (from Seeking Alpha) on top of all the other catalysts I have discussed in previous posts. {snip}
Here are the other items from the earnings conference call, including the Q&A, that caught my interest:
{snip}
Mezger went on to explain that three key factors contributed to the decline in net orders:
- The cancellation rate temporarily surged as various mortgage companies under-performed. Moreover, their primary lender, Metlife, exited the retail mortgage business in early January.
- Improved conditions in the housing market encouraged KBH to increase prices on many of the homes in its standing inventory. This slowed the clearing of unsold homes, but they are getting sold now at higher margins.
- The strategic shift out of markets in South Carolina, Charlotte, and Arizona impacted year-over-year comps.
{snip}
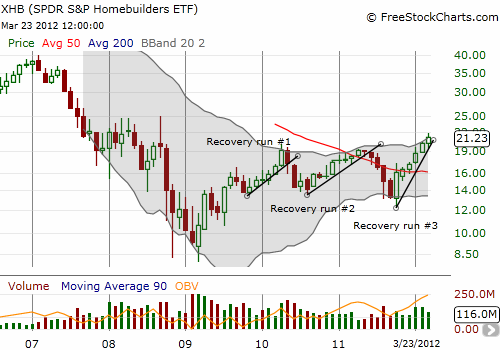
For some final context on the market’s sentiment toward homebuilders, the monthly chart for the SPDR S&P Homebuilders ETF (XHB) demonstrates that the latest “recovery run” remains strong and steeper than ever. I maintain that dips from these levels should be bought as momentum builds toward an eventual bottom in the housing market.

Source for charts: FreeStockCharts.com
Be careful out there!
(This is an excerpt from an article I originally published on Seeking Alpha on March 26, 2012. Click here to read the entire piece.)
Full disclosure: net long KBH
