(This is an excerpt from an article I originally published on Seeking Alpha on March 20, 2012. Click here to read the entire piece.)
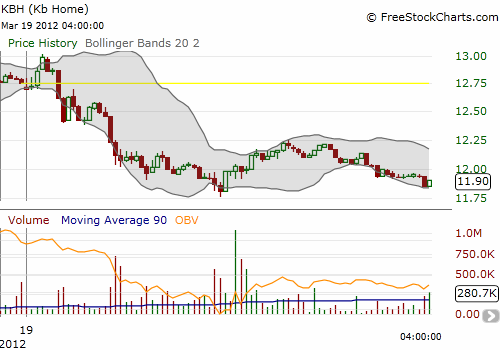
Kb Home (KBH) dropped 6.8% on Monday, March 19. KBH last sold off this heavily over four months ago. Buyers of call options rushed in to take advantage. For the April expiration, 16,396 calls, mostly at the $12, $13, and $14 strikes, versus 5,273 puts traded on the day. This bullish 0.32 put/call ratio is less than half the current put/call ratio of April open interest. The surging interest in KBH showed up in shares traded as well. The largest surge in volume occurred as KBH bounced off its lows for the day as seen in the following 5-minute intraday chart. The stock waned quickly as volume waned quickly.

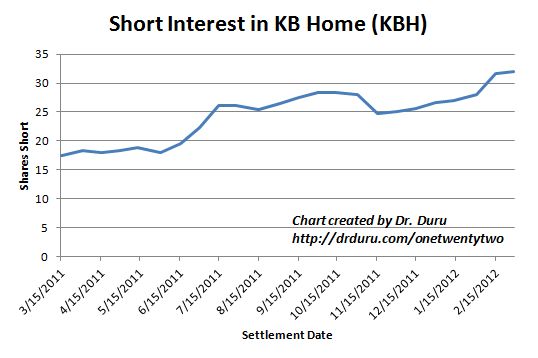
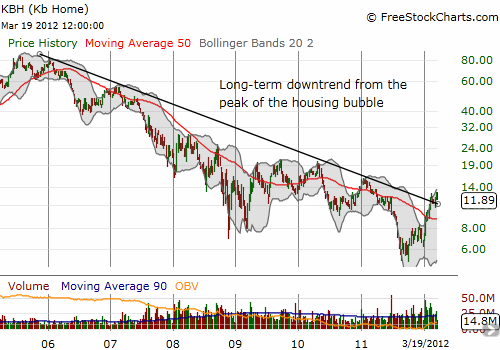
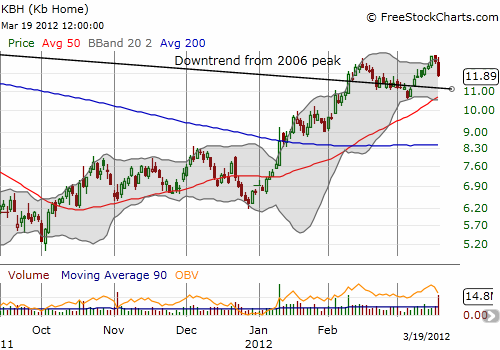
{snip} Given the large amount of short interest in KBH, I am also assuming that much of the call activity was hedging to protect positions. Shorts currently represent a whopping 59% of KBH’s float. The 126% rally off the October lows and the 77% rally for 2012 has only emboldened these bears. {snip}

Source: NASDAQ.com KBH Short Interest
In other words, bears are loading up on shorts in anticipation of a major collapse in the stock and likely also loading up on call options just in case this catastrophe gets delayed another month. Note well that KBH has not risen courtesy of a short squeeze. Shorts are not covering, they are accumulating.
Meanwhile, all the reasons I liked KB Home two months ago still stand. {snip}


Source of all charts: FreeStockCharts.com
{snip}
Be careful out there!
(This is an excerpt from an article I originally published on Seeking Alpha on March 20, 2012. Click here to read the entire piece.)
Full disclosure: net long KBH
“
