(T2108 measures the percentage of stocks trading above their respective 40-day moving averages [DMAs]. To learn more about it, see my T2108 Resource Page. You can follow real-time T2108 commentary on twitter using the #T2108 hashtag. T2108-related trades and other trades are posted on twitter using the #120trade hashtag)
T2108 Status: 69% (ending 43 days of overbought conditions)
VIX Status: 18.1
General (Short-term) Trading Call: Hold (your bearish positions should ALREADY be in place!)
Reference Charts (click for view of last 6 months from Stockcharts.com):
S&P 500 or SPY
SDS (ProShares UltraShort S&P500)
U.S. Dollar Index (volatility index)
VIX (volatility index)
VXX (iPath S&P 500 VIX Short-Term Futures ETN)
EWG (iShares MSCI Germany Index Fund)
Commentary
First, a moment of awed silence for the historic overbought period that just ended…
At 43 days, the last overbought period ranks #7 in duration amongst all the overbought periods since 1986. It just so happens that in my first analysis of overbought periods, I produced a chart of the top 6. I reproduce it below.
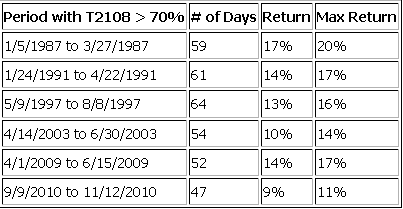
From “Trading Strategies for an Overbought S&P 500 Using the Percentage of Stocks Trading Above Their 40DMAs (‘T2108’)”
The maximum and net returns for this overbought period are right in line with its historic cousins: 7.6% and 6.8%. Note the small difference between maximum and final net returns. The long overbought periods do not end in dramatic style. It is no coincidence that the end of this overbought period feels so anti-climactic!
I also reproduce charts from my last overbought analysis overlaying the S&P 500 with the duration of past overbought periods. Note well how long overbought periods tend to occur in the middle of strong rallies – 1987 was a gut-wrenching exception. In other words, do not expect a bear market to begin now.
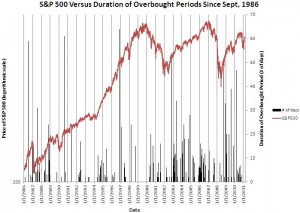
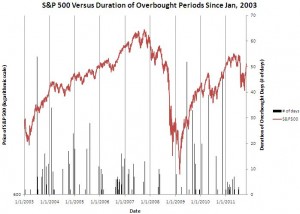
From: “Trading the S&P 500 After An Overbought Period Ends – Using the Percentage of Stocks Trading Above Their 40DMAs (‘T2108’)”
Notice that the past three years (ever since the March, 2009 lows) have featured an inordinate concentration of long overbought periods. This rare event is becoming more commonplace that it should be. I am reminded that in the final years of the last bull market, T2108 experienced an unusually high number of oversold periods. Perhaps we should assume for now that THIS bull market still has plenty of life left in it? Or do we assume that a lot more oversold periods are waiting in the near future to balance out the equation? I will be scrambling to try to answer these questions as time unfolds. As I mentioned in the last T2108 update, for now, I am assuming the stock market will follow a path similar to the end of long overbought periods in 2009 and 2010.
This overbought period was particularly intriguing because it began exactly on the first day of the year just as I projected throughout late December. Overbought conditions then persisted day after day, week after week. I was not even close to projecting this behavior and was anticipating a run-of-the-mill overbought period that matched the average 4-day duration and certainly no longer than the 9-day median. The T2108 portfolio took a beating thanks to this outlier, and I effectively watched last year’s hard-earned T2108 profits slowly fade away. I find little consolation in the extra dollars I was able to snatch in front of “the steamroller” or the harsh reality that there was simply no way to anticipate such an outlier. I am trying to transition T2108 from just another general market indicator into its own profitable little engine…
Constantly pestering me throughout this overbought period was the realization that the market’s run to 52-week highs represented the delayed fulfillment of my projection after last summer’s bounce from the gut-wrenching August lows. At that time, I assumed most sellers had been washed out, freeing the way for the S&P 500 to soar. Consistent resistance at the 50DMA and then the one-day bear market in October, convinced me that the sellers were too stubborn to let the S&P 500 fly. Yet, on October 21st, the S&P 500 finally pushed above its trading range, and I began to contemplate that this lower range was becoming history. An even stronger push on October 24th compelled me to officially project a higher range for the S&P 500 with the 52-week highs as a top and the former 2011 lows as a bottom. Here is the fateful chart I produced to make my point:
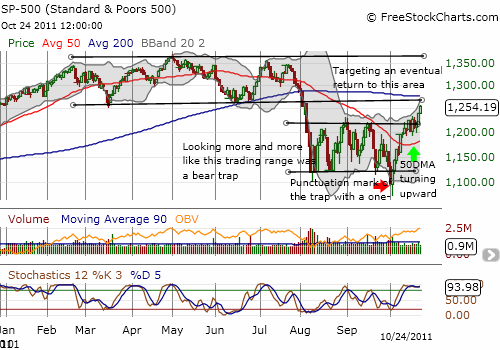
After this point, the market proceeded to turn lower again. By the November lows, I became solidly convinced that buyers simply lacked the muscle to achieve my bullish forecast, and I lowered my sights. The tantalizing dynamics provided an ample exclamation point when November’s sell-off ended short of an oversold period; an event which would have reawakened my bullish spirit. I believe T2108 got as low as 30% or so which had been the market’s typical bottom from 2009-2010.
Why do I review these tales of triumph and setback? These tales form the context and background of how I interpret the market signals going forward. I want to remind you that I am NOT an intrinsic bear. I am painfully aware I missed a HUGE payoff by allowing myself to get whipsawed out of my earlier forecast – granted it is far from clear whether I would have held my bullish positions for long through this last overbought period. I am now more resolved than ever to trust the combination of my instincts and my analysis. I see all the keys and tools of success laid out in front of us.
Here is a reminder of what the historical analysis suggests we should expect going forward:
- The maximum sell-off from here should be around 7-8%.
- It is just as likely that the sell-off will be no more than 2%.
- At least one more rally should follow whatever correction occurs. HOWEVER, the risks of a much larger sell-off will increase in the next overbought periods.
The implication for my trading is that I will close out my bearish positions on any significant dip in the next week or two. I will not wait until the next oversold period to establish aggressive bullish positions at least once. In general, my bullish positions will remain very short-term, and I will exercise a little more patience in establishing bearish T2108 positions in the next overbought periods (meaning at least wait until the second or third day). While the market gets ready for the next rally, I am going to trade as if the S&P 500 will likely bounce in a 100 point range between 52-week highs and the 200DMA which happens to coincide with a complete erasure of year-to-date gains and the maximum loss we can expect following this overbought period.
Most importantly, I will remain flexible and nimble. After all, we are still dealing with a lot of outlier behavior in the markets, and there is plenty of reason to expect more of the same.
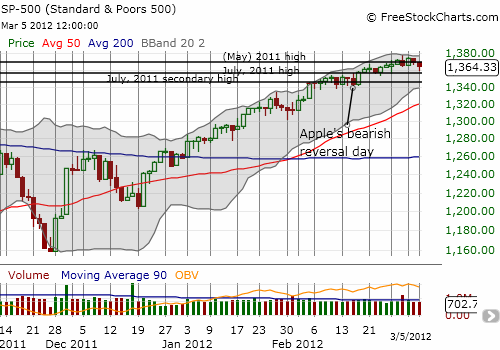
I conclude with a close-up chart of the S&P 500 showing the overbought period ended on a false breakout to new 52-week and multi-year highs as expected. The anti-climactic nature of the pullback makes this behavior feel a lot less significant than usual. I also point out the spot where Apple made the bearish reversal that was heard around the world and had me thinking that it signaled a likely market top.
Charts below are the latest snapshots of T2108 (and the S&P 500)
Refresh browser if the charts are the same as the last T2108 update.
Black line: T2108 (measured on the right); Green line: S&P 500 (for comparative purposes)
Weekly T2108

*All charts created using freestockcharts.com unless otherwise stated
Related links:
The T2108 Resource Page
Expanded daily chart of T2108 versus the S&P 500
Expanded weekly chart of T2108
Be careful out there!
Full disclosure: long SDS and VXX; long VXX puts


It is interesting that of the % return of the 4/1/2009-6/15/2009, 9/9/2010-11/12/2010 and the recent overbought period, the % return keeps *decreasing* with every period. Now this makes me wonder if the last few periods after overbought periods had smaller and smaller returns as well (or the reverse). Might you know the returns of the last few periods like this, so that we could extrapolate whether the drop will be smaller or bigger than the last one?
You have a great point showing that historically long overbought periods tend to occur in the middle of strong rallies, thus a bear market should not be expected. This is a great data-backed point that many analysts are not pointing out.
Here’s why I think this bull market has some life left in it (i.e. at least a few months or quarters minimum):
* The slope of T2100 is just as steep as in the original rally off the March 09 bottom, as well as other powerful rallies since then.
* Top-rated macro analysts are bullish because leading economic indicators (which are historically correlated to the stock market) are still improving. They’re not flattening, not turning down. Who knows in 12-18 months, but for now maybe things are still improving.
* These analysts suggest that the earliest a recession could start is October: http://advisorperspectives.com/dshort/guest/Vrba-van-Vuuren-120303-The-Elusive-2012-Recession.php
I watch a variety of market timing systems and I can say that the biggest difference between them is how much time you have to react to a signal. Some gave signals within the last few day(s) (or today) and I personally find that not long enough for me to psychologically come to terms with.
Regarding the November 2011 drop, my advice for you is to either find more indicators to be able to trade that drop, or find some fundamental analysis that will convince you to keep holding through that period (that’s what I did [papertrading] since I didn’t know as many indicators then).
Anyway, I love your blog, keep up the great work. I look forward to seeing you call the bottom. 🙂
Thanks for the encouragement and the continued stream of great links and data! Back in November, another reader was suggesting something similar – consider other indicators or adjusting the rules. At the time, I didn’t have anything that would justify adjusting the rules, and I was afraid it was a slippery slope! Looking back again, I am realizing that, ironically enough, the classic 50 and 200DMA lines of support and resistance were the real culprits distracting me! Lol
Anyway, not sure I will have time to list out the returns of the last few overbought periods just yet. I do have them in a spreadsheet as part of the historical analyses I have done. For tonight, I need to pound out a few other posts! I have some hard thinking to do on how to time the bottom of this corrective phase after all…