(T2108 measures the percentage of stocks trading above their respective 40-day moving averages [DMAs]. To learn more about it, see my T2108 Resource Page. You can follow real-time T2108 commentary on twitter using the #T2108 hashtag. T2108-related trades and other trades are posted on twitter using the #120trade hashtag)
T2108 Status: 75% (overbought day #40)
VIX Status: 18.4
General (Short-term) Trading Call: Close more bullish positions. Begin but do NOT expand an existing bearish position.
Reference Charts (click for view of last 6 months from Stockcharts.com):
S&P 500 or SPY
SDS (ProShares UltraShort S&P500)
U.S. Dollar Index (volatility index)
VIX (volatility index)
VXX (iPath S&P 500 VIX Short-Term Futures ETN)
EWG (iShares MSCI Germany Index Fund)
Commentary
T2108 closed below 80% for the first time in 6 weeks. This decline is a major confirmation of the on-going, two week downtrend in T2108. This is also a very rare follow-through or confirmation of a major bearish signal for this 40-day old overbought period (now all alone at #7 in duration since 1986). This drop in T2108 follows a series of bearish signals I have pointed out over the past week:
- Feb 22: A drop in T2108 to 80% that retested a similar drop exactly one week earlier. (What is up with Wednesday’s?)
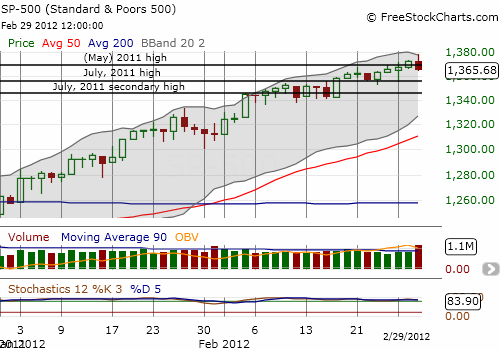
- Feb 24: I recommended that bears sharpen their pencils given a continuing drop in trading volume, a continued downtrend in T2108, and the S&P 500 fading from resistance at 52-week (and multi-year) highs. I recommended that anyone without a bearish position start one and any further gains for the S&P 500 would likely be a false breakout.
- Feb 28: T2108 finally showed some different behavior by dropping back to 80% even though the S&P 500 rallied to new 52-week and multi-year highs. The anemic trading volume underlined the bearish divergence.
Today, the S&P 500 rallied at the open only to fall back BELOW the previous day’s lows. And trading volume? Yep. It increased. Technicians will see a false breakout in this ominous move.

It seems to me the end of this overbought period is near. The biggest question now is whether the end will come with significant selling or a mild drift downward. My historical analysis on post-overbought trading suggests that the S&P 500 will suffer a MAXIMUM loss of about 8% after this overbought period ends. It is also just as likely the S&P 500 will lose less than 1%. In other words, I must re-emphasize that if you want to establish a bearish position, NOW is the time to do it. Waiting until the end just exposes you to a higher risk of getting caught in a new surge higher in the S&P 500. Of course, if you prefer to stay bullish, you can lock in profits here (which you should have already done) and wait for a dip to buy again.
Finally, consider an interesting scenario. The overbought period may end with little fanfare before the S&P 500 turns upward again. This next overbought period only lasts a few days and exposes the market to a much larger potential sell-off (again, see the overbought analysis for the range of possibilities).
Overall, we will need to maintain open minds, stay nimble, and expect to get mentally tested. This overbought period was a very rare event, so we have to be prepared. We must also avoid over-thinking the trading rules and recognize the limits of our knowledge when experiencing a long tail event.
Charts below are the latest snapshots of T2108 (and the S&P 500)
Refresh browser if the charts are the same as the last T2108 update.
Black line: T2108 (measured on the right); Green line: S&P 500 (for comparative purposes)
Weekly T2108

*All charts created using freestockcharts.com unless otherwise stated
Related links:
The T2108 Resource Page
Expanded daily chart of T2108 versus the S&P 500
Expanded weekly chart of T2108
Be careful out there!
Full disclosure: long SDS and VXX; long VXX puts


In terms of the sector ETFs, it looks like XLE is pulling back some. XLK is still going up, but Sentimentrader had a report that when stocks reach $500b (like AAPL), they often correct quite a bit (and also signal some sort of market top).
http://www.cobrasmarketview.com/2012/02292012-aapl-review/
Here is a report about how a large premium spread between the VIX Cash Index and VIX Futures suggest a large drop coming soon:
http://www.optionpundit.net/technical-analysis/why-and-who-is-buying-puts-now
So, it seems like the moment of truth (i.e. drop or not) is coming soon.
Thanks for sending all these great technical analyses. I like the way they seem to confirm/support the signals I focus on here.
Regarding the spread between the VIX Cash Index and the VIX Futures, I’m no longer sure if that is a valid signal because of issues like this:
http://www.indexuniverse.com/sections/features/11183-volatility-etfs-often-own-all-vix-futures.html
That was an amazing analysis! Thanks again for the heads up! I am glad to see a great article explaining why going long volatility products is mainly a death wish! Amazing how these ETFs have come to completely dominate the market for volatility futures.