(T2108 measures the percentage of stocks trading above their respective 40-day moving averages [DMAs]. To learn more about it, see my T2108 Resource Page. You can follow real-time T2108 commentary on twitter using the #T2108 hashtag. T2108-related trades and other trades are posted on twitter using the #120trade hashtag)
T2108 Status: 77% (overbought day #9)
VIX Status: 20.9
General (Short-term) Trading Call: Close more bullish positions, begin/expand bearish positions
Reference Charts (click for view of last 6 months from Stockcharts.com):
S&P 500 or SPY
SDS (ProShares UltraShort S&P500)
U.S. Dollar Index (volatility index)
VIX (volatility index)
VXX (iPath S&P 500 VIX Short-Term Futures ETN)
EWG (iShares MSCI Germany Index Fund)
Commentary
Just when you thought the changes for quantitative easing part 3 (QE3) had evaporated…speculation is now growing the Federal Reserve may consider implementing QE3 by the spring. I unwittingly mentioned this possibility in discussing reasons for buying the dips in homebuilders. While the “T2108 Update” is strictly dedicated to a technical analysis of the stock market, I have to pay respects to QE3 because flooding the stock market with more liquidity pretty much trumps everything, at least for the short-term (QE2 eventually ran out of steam and lost the vast majority of its impact on the stock market once it reached its 2011 lows). There is almost nothing more important to the stock market than the crack of easy money. The anticipation of QE3 means that a solid floor likely exists under the stock market until something happens to eliminate this speculation. It can probably explain why traders seem so eager to buy morning gap downs.
CNBC’s Steve Liesman shares some reasons more easing is on the way (also read “Fed to Weigh Further Easing Amid Doubts About Recovery“):
This QE3 wildcard forces me to increase my wariness here at overbought levels. Any pressure that existed to sell going into this overbought period is greatly diminished by traders and investors hoping to get saved by more money-printing by the Federal Reserve. T2108 is overbought for the ninth day in a row, right at the average but well above the median of four days. Only 29% of all overbought periods have lasted longer; 19% of all overbought periods have lasted longer than 14 days. After 25 days, the S&P 500 tends to pick up fresh momentum. The Fed next announces monetary policy on January 25th. That meting day would print day #16 of the overbought period. This will still be two trading weeks away from the time where we would expect the S&P 500 to take off. However, if the Federal Reserve telegraphs that QE3 is imminent, the party could start early. On the flip side, if the Fed disappoints, we could finally get the sharp selling that typically ends an overbought period.
In other words, T2108 traders will have to both exercise patience and extreme caution…worse still, keep a third eye on the headlines regarding the Federal Reserve’s intentions. If you have read this far without reviewing the short video I posted from CNBC, then go back and do so now. This is the ONE case where I will actually pay attention to fundamental news to further inform the T2108 trade.
The U.S. dollar may also be exposing the Federal Reserve’s intentions. Mainly thanks to the on-going plunge in the euro, the dollar index now sits at 52-weeks highs set in January, 2011. The dollar index is only another 2.4% gain away from its level when the Federal Reserve telegraphed QE2 at the end of August, 2010 (click here for an extended chart). No matter what Ben Bernanke says in public, I am convinced he believes the dollar remains over-valued and must be weaker to support an economic recovery. His logic would be no different than that of Mervyn King, the governor of the Bank of England. King has been free to express his underlying desire and appreciation for a weaker currency. Bernanke is handcuffed by the U.S. Treasury’s obligatory official support of a strong U.S. dollar. At a bare minimum, the dollar’s rise means that the Federal Reserve can feel it has more room to execute dollar-weakening monetary policies. The Fed may still have to navigate the political minefield Congress has laid before it, but the dovish change in the guard may provide a deeper well of courage for exerting the Fed’s political independence.
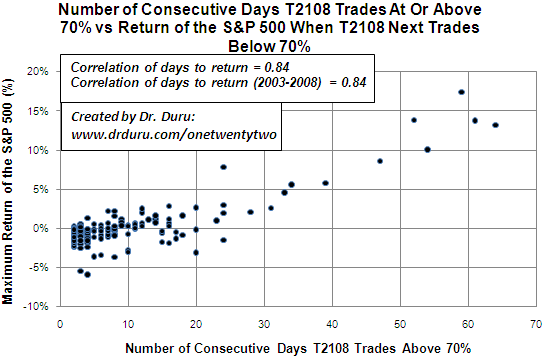
Finally, the S&P 500 is churning away in a very slow upward trend. Since T2108 first closed at an overbought level, the S&P 500 has only managed to gain an additional 0.9%. Again, this paltry performance is typical for overbought periods…until they reach almost a month in age. I reproduce below the scatter plot relating returns to the duration of the overbought period. This chart also explains why I am still waiting for one more surge in the S&P 500 before further expanding my bearish T2108 portfolio. If you are not yet familiar with my analysis of overbought periods, I highly recommend you get familiar now. It will help you manage risks appropriately.

Charts below are the latest snapshots of T2108 (and the S&P 500)
Refresh browser if the charts are the same as the last T2108 update.
Black line: T2108 (measured on the right); Green line: S&P 500 (for comparative purposes)
Weekly T2108

*All charts created using freestockcharts.com unless otherwise stated
Related links:
The T2108 Resource Page
Expanded daily chart of T2108 versus the S&P 500
Expanded weekly chart of T2108
Be careful out there!
Full disclosure: long SDS; long VXX calls and puts; long euro (against the Swiss franc), long U.S. dollar (versus the euro and the pound)

