(T2108 measures the percentage of stocks trading above their respective 40-day moving averages [DMAs]. To learn more about it, see my T2108 Resource Page. You can follow real-time T2108 commentary on twitter using the #T2108 hashtag. T2108-related trades and other trades are posted on twitter using the #120trade hashtag)
T2108 Status: 71% (overbought day #3)
VIX Status: 21.5
General (Short-term) Trading Call: Close more bullish positions, begin/expand bearish positions
Commentary
T2108 remains on the edge of overbought territory for a third day. The S&P 500 has made almost no progress since Tuesday’s small rally. Given the median length of an overbought period is four days, I decided to go ahead and expand my position in SDS by 50%. I am reserving a third tranche for a later time in case the S&P 500 continues to extend the overbought period.
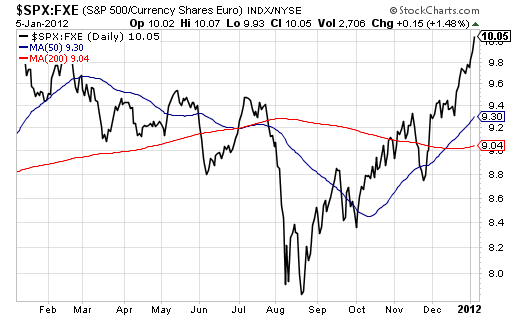
My speculation on VXX calls looks ready to flop already. VXX closed at 5-month lows – time to create a strangle position with VXX puts. The VIX is still trapped in converging support and resistance, but it is looking like resistance will fail. This failure will be pretty surprising given the euro continues to plunge, and Europe’s sovereign debt crisis continues to deepen. I will have more to say on this “euro fatigue” in another post. In the meantime, here is a chart of the ratio of the S&P 500 and FXE, the Rydex Currency Shares Euro Trust ETF, showing the strong out-performance of the S&P 500 versus the euro since the August swoon.

Source: Stockcharts.com
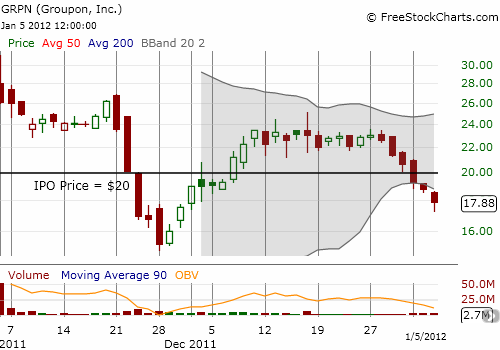
In other news, I finally closed out my puts in Groupon (GRPN). The stock broke down below its IPO price to start the year even as the stock market rallied; a sure sign of worse things to come. While I suspect GRPN will suffer mightily once the stock market sells off from overbought conditions, I decided to lock in profits. I want to reload into the next buying spree.

Charts below are the latest snapshots of T2108 (and the S&P 500)
Refresh browser if the charts are the same as the last T2108 update.
Black line: T2108 (measured on the right); Green line: S&P 500 (for comparative purposes)
Weekly T2108

*All charts created using freestockcharts.com unless otherwise stated
Related links:
The T2108 Resource Page
Expanded daily chart of T2108 versus the S&P 500
Expanded weekly chart of T2108
Be careful out there!
Full disclosure: long SDS and long VXX calls, long euro (versus the franc and the yen – to be explained in another post)

