(T2108 measures the percentage of stocks trading above their respective 40-day moving averages [DMAs]. To learn more about it, see my T2108 Resource Page. You can follow real-time T2108 commentary on twitter using the #T2108 hashtag. T2108-related trades and other trades are posted on twitter using the #120trade hashtag)
T2108 Status: 49%
VIX Status: 21
General (Short-term) Trading Call: Hold
Commentary
T2108 barely budged as the S&P 500 recovered early losses to end the day flat. The index made a picture-perfect bounce off its 50DMA.
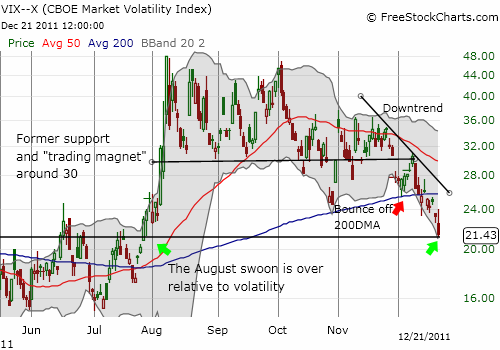
The most interesting development today was the further DECLINE in the VIX, the volatility index. In yesterday’s T2108 update, I noted the downtrend developing in the VIX. Wednesday’s 7.7% drop in volatility essentially confirms the downtrend. The VIX has now lost ALL of its gains from the S&P 500’s swoon that accelerated in August.

I never would have guessed that the VIX would mark such a roundtrip with the S&P 500 still struggling with overhead resistance and well off 52-week highs. In fact, I would have expected to see the S&P 500 in the middle of a sharp rally amidst soaring market sentiment.
Regardless, I decided to sell my VXX puts and hold my VXX shares. I will look to dump those shares on the next rally in volatility. I am assuming it will eventually bounce to at least hit the upper limit of the downtrend channel. After that, my bias will remain bearish on VXX until the technicals say otherwise. And, yes, it sure feels odd being BOTH bearish on volatility AND the S&P 500!
Charts below are the latest snapshots of T2108 (and the S&P 500)
Refresh browser if the charts are the same as the last T2108 update.
Black line: T2108 (measured on the right); Green line: S&P 500 (for comparative purposes)
Weekly T2108

*All charts created using freestockcharts.com unless otherwise stated
Related links:
The T2108 Resource Page
Expanded daily chart of T2108 versus the S&P 500
Expanded weekly chart of T2108
Be careful out there!
Full disclosure: long SDS and VXX; long VXX calls; net long U.S. dollar; net short euro, long GS shares

