(T2108 measures the percentage of stocks trading above their respective 40-day moving averages [DMAs]. To learn more about it, see my T2108 Resource Page. You can follow real-time T2108 commentary on twitter using the #T2108 hashtag. T2108-related trades and other trades are posted on twitter using the #120trade hashtag)
T2108 Status: 67%
VIX Status: 29
General (Short-term) Trading Call: Continue building very small bearish position. Should have closed out at least one bullish trading position by now. Otherwise hold.
Commentary
The market is essentially drifting around, still waiting for the next catalyst. For 3 of the last 5 days, T2108 has been above 65% and as high as 68%. For all 5 of these days, T2108 has been above 60%.
The S&P 500 has also lingered. For the third straight day, the index has crossed above and then closed below its 200DMA. The two days before these last 3 days featured an S&P 500 reaching toward its 200DMA but fading back to close on a very slight negative note.
Meanwhile, the VIX has remained below the critical support/resistance level of 30 for the sixth straight day. This is the longest stretch since the August swoon, but the VIX has been slowly drifting upward since the 200DMA support held.
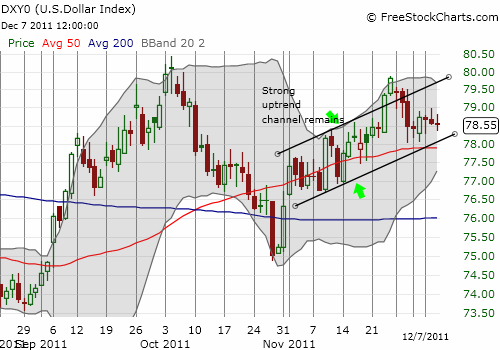
Even the U.S. dollar index is still waiting for a new catalyst as it drifts horizontally within the channel trending upward.

Until the next catalyst disturbs this uneasy equilibrium, traders should be writing out and rehearsing their trading plans. I am finished building up a SMALL bearish position consisting mainly of SDS and VXX shares and calls. As a reminder, if the S&P 500 closes ABOVE its 200DMA resistance AND follows-through with further upside, the market will regain a more bullish posture. However, given T2108 will be overbought at that time, I will be standing by and watching and waiting for the next lower risk setup. Again, I expect January will return any euphoric gains generated in December.
Charts below are the latest snapshots of T2108 (and the S&P 500)
Refresh browser if the charts are the same as the last T2108 update.
Black line: T2108 (measured on the right); Green line: S&P 500 (for comparative purposes)
Weekly T2108

*All charts created using freestockcharts.com unless otherwise stated
Related links:
The T2108 Resource Page
Expanded daily chart of T2108 versus the S&P 500
Expanded weekly chart of T2108
Be careful out there!
Full disclosure: long SDS and VXX; long VXX calls; net long U.S. dollar

