(T2108 measures the percentage of stocks trading above their respective 40-day moving averages [DMAs]. To learn more about it, see my T2108 Resource Page. You can follow real-time T2108 commentary on twitter using the #T2108 hashtag. T2108-related trades and other trades are posted on twitter using the #120trade hashtag)
T2108 Status: 35%
VIX Status: 32
General (Short-term) Trading Call: Hold.
Commentary
T2108 closed at 35% and continued its slide toward the high end of the currently projected range (20-30%). The S&P 500 stayed essentially flat while volatility dropped 3%. Volatility remains tame as expected.
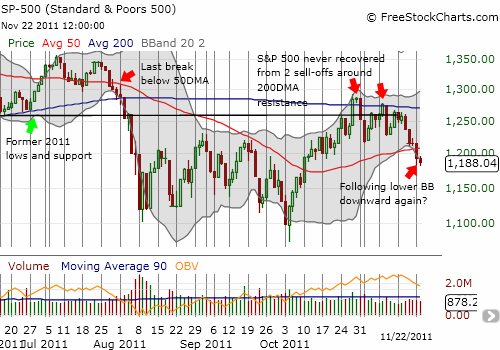
In previous posts, I failed to emphasize why the 50DMA support was so important for the S&P 500. The chart below highlights what happened the last time the index broke this line of support – in eight trading days the index broke through lows for the year on its way to an overall loss of 15%.

Note that in July, the S&P 500 followed the lower Bollinger Band (BB) downward. A similar pattern has appeared in today’s chart.
Only a fresh close above the 50DMA will BEGIN to rinse away my renewed bearishness. Even then, the 200DMA should once again serve as stiff resistance to further progress.
Charts below are the latest snapshots of T2108 (and the S&P 500)
Refresh browser if the charts are the same as the last T2108 update.
Black line: T2108 (measured on the right); Green line: S&P 500 (for comparative purposes)
Weekly T2108

*All charts created using freestockcharts.com unless otherwise stated
Related links:
The T2108 Resource Page
Expanded daily chart of T2108 versus the S&P 500
Expanded weekly chart of T2108
Be careful out there!
Full disclosure: long SDS

