(T2108 measures the percentage of stocks trading above their respective 40-day moving averages [DMAs]. To learn more about it, see my T2108 Resource Page. You can follow real-time T2108 commentary on twitter using the #T2108 hashtag. T2108-related trades and other trades are posted on twitter using the #120trade hashtag)
T2108 Status: 58%
VIX Status: 32
General (Short-term) Trading Call: Identify new bullish plays, but prepare to go long VXX. Otherwise hold.
Commentary
Friday’s trading action was surprisingly dull given Thursday’s plunge and options expiration. T2108 ended flat at 58%, and the S&P 500 closed down a fraction of a point. Perhaps out of boredom the VIX dropped 7%.
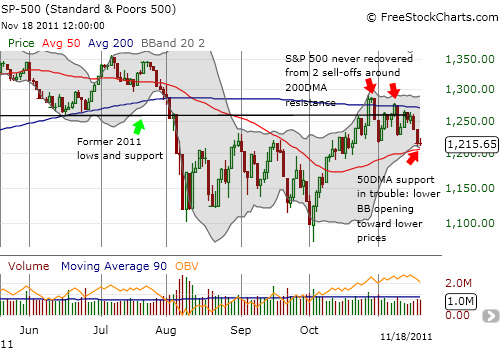
The most notable technical event on Friday was the downward turn of the lower-Bollinger Band (BB) on the S&P 500. This change warns us that the support at the 50DMA may be quite tenuous. Thus, I am NOT recommending purchasing any trading longs here. Without the change in the lower-BB, I would have continued to assume the 50DMA support would hold firm. Now, I want to at least see a CLOSE above Friday’s high at 1225 before I even consider any trading longs. Recall that a close below the 50DMA completely changes my technical outlook from bullish to bearish, meaning I will expect T2108 to hit oversold before it re-enters overbought territory.
The chart below summarizes the current technical outlook along with a reminder of the failure at resistance that brought the S&P 500 to the current setup.

Given the more ominous appearance of the chart, I will be looking to get long VXX. I will likely wait until at least the end of this week given I THINK volatility should be muted for this holiday-shortened week.
Charts below are the latest snapshots of T2108 (and the S&P 500)
Refresh browser if the charts are the same as the last T2108 update.
Black line: T2108 (measured on the right); Green line: S&P 500 (for comparative purposes)
Weekly T2108

*All charts created using freestockcharts.com unless otherwise stated
Related links:
The T2108 Resource Page
Expanded daily chart of T2108 versus the S&P 500
Expanded weekly chart of T2108
Be careful out there!
Full disclosure: long SDS, net long US dollar

