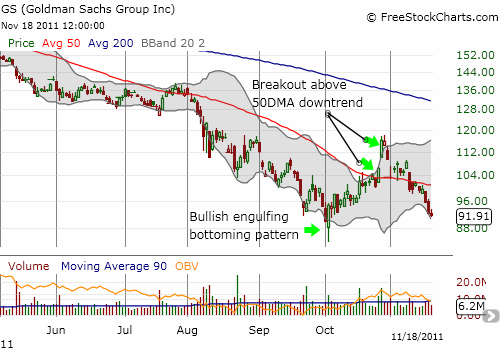
In late October, I claimed that Goldman Sachs (GS) had finally found a bottom after two years of mostly declining prices. It has been all downhill for GS ever since.
The chart below shows the signals I used to decide GS had finally printed a bottom. Note that on November 9, GS sliced cleanly and easily right through the 50-day moving average (DMA) line of support. The continued selling has brought GS within 2% of its closing 52-week (and 2 1/2 year low). Technically, GS is now a stock to short on rallies with a stop above the still declining 50DMA.

Source: FreeStockCharts.com
As the Occupy Wall Street protests continue to gain momentum, we should expect continued weak performance from the likes of GS. For example, in “Lobbying Firm Memo To Advise Wall Street Clients On Occupy Movement,” the Huffington Post claims that a pending memo from lobbying firm Clark, Lytle, Geduldig, Cranford advises its Wall Street clients that even Republicans may soon find themselves forced to abandon Wall Street interests. I will likely abandon my GS shares in the next bounce.
Be careful out there!
Full disclosure: long GS
