(T2108 measures the percentage of stocks trading above their respective 40-day moving averages [DMAs]. To learn more about it, see my T2108 Resource Page. You can follow real-time T2108 commentary on twitter using the #T2108 hashtag. T2108-related trades and other trades are posted on twitter using the #120trade hashtag)
T2108 Status: 81% (15th day of the overbought period)
VIX Status: 30
General (Short-term) Trading Call: Hold
Commentary
T2108 continued its recovery from the edge of overbought territory and jumped to 81%. This is now the 15th straight day in overbought territory. Less than 20% of all overbought periods have lasted this long…and I strongly suspect overbought conditions will not last much longer. As a result, I actually BOUGHT VXX calls on Friday in anticipation of a swift sell-off at some point next week that sends volatility, and VXX, soaring again. Note well that the VIX is back at 30. This level was support in the previous trading range from August to mid-October; the VIX has bounced around this level ever since.
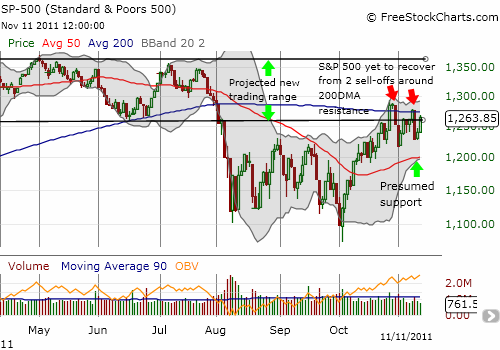
Again, the target low on the S&P 500 is the 50DMA which still hovers around 1200. The hints for a sell-off are subtle, but I am paying more attention to them given the extreme overbought conditions. The S&P 500 has experienced two sharp sell-offs in the past two weeks, and the index has yet to recover from either one. Both sell-offs occurred at or around the 200DMA resistance. This also means that the S&P 500 has been waning at the lower part of the presumed new (projected) trading range. The lower highs and higher lows in this churn are essentially forming a wedge or triangle pattern (not drawn below). Given the proximity to resistance and the overbought conditions, I am assuming this will lead to a breakdown.

My big misses of the week were my “euro panic” plays: EWG (iShares MSCI Germany Index Fund), SI (Siemens), and DB (Deutsche Bank). I decided to stay patient this time, anticipating clean breaks of the 50DMA support lines. Instead, they each bounced right back and have printed impressive 2-day recovery rallies. My lesson for the future is to translate caution into slow execution. That is, buy a “half” position in EWG so I have something in hand in the case of a sharp recovery. Otherwise, accumulate more stock upon additional selling.
Charts below are the latest snapshots of T2108 (and the S&P 500)
Refresh browser if the charts are the same as the last T2108 update.
Black line: T2108 (measured on the right); Green line: S&P 500 (for comparative purposes)
Weekly T2108

*All charts created using freestockcharts.com unless otherwise stated
Related links:
The T2108 Resource Page
Expanded daily chart of T2108 versus the S&P 500
Expanded weekly chart of T2108
Be careful out there!
Full disclosure: long SDS, long puts and calls on VXX

