(T2108 measures the percentage of stocks trading above their respective 40-day moving averages [DMAs]. To learn more about it, see my T2108 Resource Page. You can follow real-time T2108 commentary on twitter using the #T2108 hashtag. T2108-related trades and other trades are posted on twitter using the #120trade hashtag)
T2108 Status: 77% (almost overbought)
VIX Status: 29 (below previous trading range for a second time)
General (Short-term) Trading Call: Start closing out bullish trades, identify bearish trades for execution between now and 200DMA resistance.
Commentary
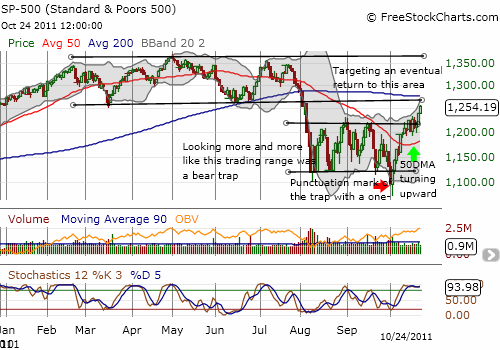
It is official. T2108 has returned to overbought territory after a 3 1/2 month hiatus (T2108 hit 69% 3 months ago). With a 9 percentage point surge, T2108 closed at 77%, a high for the year. This move is also the biggest one-day surge into overbought territory for 2011. The S&P 500 has consistently sold off each time T2108 has hit this level. Today’s trading call reflects the high likelihood of a pullback, especially if/when the S&P 500 tests upper resistance at the 200DMA. However, as I have been careful to note, with on-balance volume (OBV) trending upward for the last 2 1/2 months, I am assuming traders and investors are in a strong accumulation phase that will likely bound downside risk to the upward-bending 50DMA.
After the next pullback, I am now targeting the S&P 500 for a return to the wide trading range that dominated much of the year before July’s vicious sell-off.

Note well that stochastics remain overbought. With T2108 overbought and the 200DMA ready to provide resistance, a notable pullback seems all but certain within the next day or two. Again, the soft target for this pullback is no lower than the 50DMA. A break below this support will switch me to a bearish forecast. I suspect the top of the previous trading range may provide a sufficient springboard.
For those of you who have hung in there with me through the trading range and this breakout, you know that I have made these calls paying almost no attention to the “fundamental” news. You should duly note that the market has told us everything we need to know for these short to intermediate trades. The bears have PLENTY of reasons to hate the market, the economy, you name it (do not forget the ECRI’s forecast for the U.S. to tip into a recession soon). For this very reason, we can expect short-covering and late-to-the-party buying to likely add more support to the market as it stubbornly refuses to give in to the negative fundamentals. This is NOT a reference to “climbing the wall of worry.” I HATE that phrase specifically because bulls only use it when the market is rising.
I also think the market has told us what we need to know for 2012’s likely bear market, but clearly we have a long way to go to see whether THAT scenario completely plays out. Notice we got the strong October rally that I projected, but it was from a much lower level than the scenario I expected. Overall, neither a confirmation nor rejection of the analysis.
Per Friday’s trading call, I closed a few bullish positions today; I plan to sell more on the next move upward. Most notably, I sold my January calls on Ford Motor Company (F). It was not easy to release this position, but rules are rules. Moreover, I managed to achieve a double. Ford’s momentum is strong, so I think it is a buy on the dips.
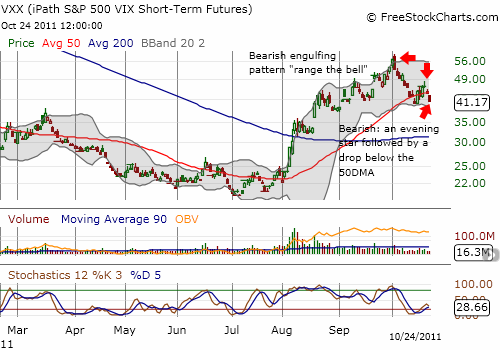
Finally, the VIX has broken down again below the previous trading range with a failed test of the declining 50DMA. No matter what happens in the gyrations of the S&P 500, I fully expect volatility to continue its decline. In particular, VXX should rapidly decline. VXX is below its 50DMA again, and has printed yet another classic bearish (shorting) sign. Recall that the bearish engulfing pattern from October 4 was one of the strongest bearish signs we will ever see in a stock chart. The follow-through was also a classic. Note that while OBV remains relatively high, it has remained stalled since VXX’s initial surge in August. In this case, OBV is neither bullish nor bearish.

Charts below are the latest snapshots of T2108 (and the S&P 500)
Refresh browser if the charts are the same as the last T2108 update.
Black line: T2108 (measured on the right); Green line: S&P 500 (for comparative purposes)
Weekly T2108

*All charts created using freestockcharts.com unless otherwise stated
Related links:
The T2108 Resource Page
Expanded daily chart of T2108 versus the S&P 500
Expanded weekly chart of T2108
Be careful out there!
Full disclosure: long SSO, long puts on VXX

