(T2108 measures the percentage of stocks trading above their respective 40-day moving averages [DMAs]. To learn more about it, see my T2108 Resource Page. You can follow real-time T2108 commentary on twitter using the #T2108 hashtag. T2108-related trades and other trades are posted on twitter using the #120trade hashtag)
T2108 Status: 56%
VIX Status: 35
General (Short-term) Trading Call: Hold
Commentary
Over the past 5 or 6 days, T2108 has bounced around in a tight range along with the S&P 500. Since hitting 53% last Wednesday, October 12, T2108 has gone no lower than 53% but also no higher than 61%. The S&P 500 has hugged the top of the previous trading range during this time. Unfortunately, the VIX has continued to trickle upward. This increase in volatility is a bad sign: with the S&P 500 churning, volatility looks like a crouching tiger waiting to strike.
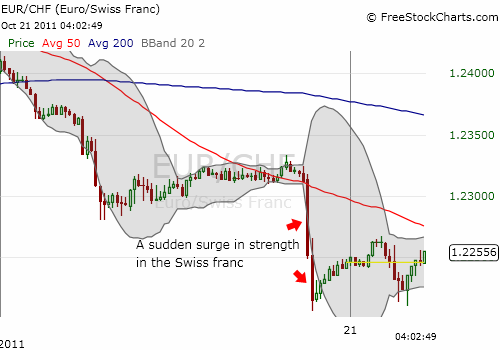
It is bad enough the VIX is nestled comfortably back into the previous trading range. NOW we have the Swiss Franc to add to our worries. On Thursday evening, the Swiss franc suddenly rose on a burst of strength in about 30 minutes, gaining around 0.8% against the euro. In earlier posts I have claimed that traders will test the resolve of the Swiss National Bank (SNB) to support its peg to the euro at no lower than 1.20 (EUR/CHF). Perhaps that test has finally started. Regardless, I am leery that this episode is also a prelude to another big run to “safety.” If so, stocks may eventually experience a strong bout of selling.

The euro has not been this low against the franc since October 5, and I believe this is the strongest surge in the franc against the euro since the SNB committed to pegging the currency. The EUR/CHF pair drifted close to 1.25 on October 19th, a near 5-month high. Thus, this pullback is particularly ominous.
[I am long overdue for a post on currencies. Here is a summary of where I stand: still bullish the dollar (above its 200DMA), very bearish against the pound (printing more money through another round of quantitative easing), bearish on the yen (currency intervention supposedly coming soon). If the the franc continues to gain strength, the dollar will likely lose some strength by virtue of a migration of safety-seekers from the dollar to the franc].
I continue to stick to my forecast that T2108 will next hit overbought levels before oversold levels. I want to remain unapologetically bullish here, but convincingly bearish counter-evidence is starting to creep back into the picture. Stay tuned!
Charts below are the latest snapshots of T2108 (and the S&P 500)
Refresh browser if the charts are the same as the last T2108 update.
Black line: T2108 (measured on the right); Green line: S&P 500 (for comparative purposes)
Weekly T2108

*T2108 charts created using freestockcharts.com
Related links:
The T2108 Resource Page
Expanded daily chart of T2108 versus the S&P 500
Expanded weekly chart of T2108
Be careful out there!
Full disclosure: long SSO, long puts on VXX, net long U.S. dollar, net short British pound, net short Japanese yen, net short euro, net long Swiss franc

