(T2108 measures the percentage of stocks trading above their respective 40-day moving averages [DMAs]. To learn more about it, see my T2108 Resource Page. You can follow real-time T2108 commentary on twitter using the #T2108 hashtag.)
T2108 Status: 32% (ends last oversold period at 2 days)
VIX Status: 38
General (Short-term) Trading Call: Hold
Commentary
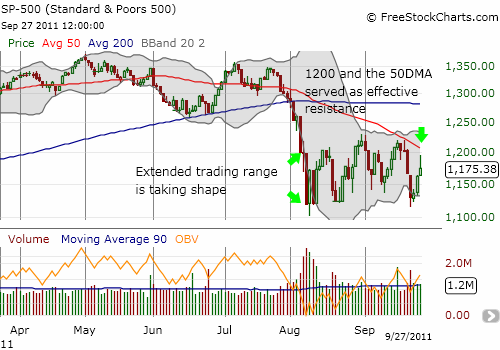
Today’s market action featured a strong follow-through to yesterday’s bounce out of oversold conditions….until the last two hours or so of trading. By the time the closing bell rang, the S&P 500 was left with a 1.1% gain after gaining as much as 2.5% on the day. This churn was a microcosm of the larger trading range that has trapped the S&P 500 since early August. The 50DMA essentially served as upper resistance (along with the even number 1200).

As planned, I sold the SSO shares that I purchased at the beginning of the last oversold period. I remain overweight long from the oversold period prior to the last one. Until the trading range breaks, there is no need to do anything different.
Caterpillar (CAT) continues to gain my attention. I earlier used it as an indicator of the market’s downside risk when it gapped down to fresh 2011 lows. I next stated that an important turn-around would start with filling the gap. CAT would then need to break above the former 2011 lows which now represent resistance. Today, CAT surged into the gap and filled it perfectly. However, the market’s weak close prevented further gains. CAT now needs to hold onto the new 2011 lows…otherwise the stock will confirm an extended downtrend continues to unfold. Such trading action will be a very bad sign for the general market. On the positive side, if CAT can soon close above today’s high, I am thinking such action will be a bullish sign for a more lasting bottom.
Charts below are the latest snapshots of T2108 (and the S&P 500)
Refresh browser if the charts are the same as the last T2108 update.
Black line: T2108 (measured on the right); Green line: S&P 500 (for comparative purposes)
Weekly T2108

*T2108 charts created using freestockcharts.com
Related links:
The T2108 Resource Page
Expanded daily chart of T2108 versus the S&P 500
Expanded weekly chart of T2108
Be careful out there!
Full disclosure: long SSO

