(T2108 measures the percentage of stocks trading above their respective 40-day moving averages [DMAs]. To learn more about it, see my T2108 Resource Page. You can follow real-time T2108 commentary on twitter using the #T2108 hashtag.)
T2108 Status: 19% (Day #17 of the current oversold period).
VIX Status: 36
General (Short-term) Trading Call: Only add to bullish positions on dips. Hold any remaining bearish positions as small hedges.
Commentary
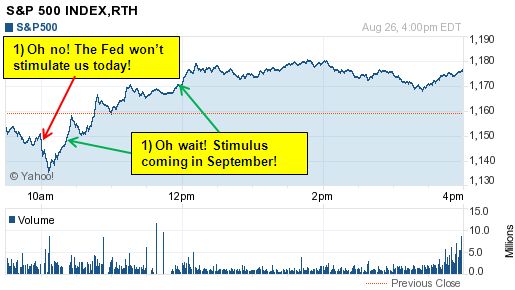
The S&P 500 rallied 1.5%, but it was not enough to pull T2108 out of oversold territory. For the third time in eight trading days, T2108 stopped at 19%, two tantalizing percentage points away from exiting oversold conditions. The 20DMA also served as stiff resistance again (see chart here). The intra-day action was another reminder of why I advise ignoring the headlines during the oversold period:

Source: Yahoo!Finance
The VIX, the volatility index, remains uncomfortably high although it dropped 10% on the day. Once it breaks the recent low around 31, I think a more sustained rally will finally ensue (current chart here).
Next week will be the final trading week of the Wall Street summer. This means three things:
- Look out for a potential big rally day on the first day of September (beginning of the month trade).
- Look for numerous reminders about how September and October are the worst performing months of the year – this will add some extra element of fear in the market.
- If the S&P 500 remains down for the year at the end of this week, odds are high that the index will end the year on a down note (note that I need to update my 2007 analysis on the “post-Labor Day trade but this relationship has been consistent for decades).
If it were not for the looming fears of recession, I would guess that traders and investors who actually managed to vacation from the market this summer will return and conclude that the market is incredibly cheap. Instead, I think the post-Labor Day action can go either way.
Finally, note that the S&P 500 is on track for a decidedly negative summer, making it depart from the historical tendency to return positive gains AND opportunities to get out of the market at or above May’s highs. The tremendously high downside risk for this summer is consistent with my assessment that summer trading tends to offer positive gains but with very high downside risks. Of course, using T2108, we turned downside risk into opportunities to go short, and the subsequent selling into opportunities to go long. T2108 should remain a very important guidepost heading into September and October.
Charts below are the latest snapshots of T2108 (and the S&P 500)
Refresh browser if the charts are the same as the last T2108 update.
Daily T2108 vs the S&P 500

Black line: T2108 (measured on the right); Red line: S&P 500 (for comparative purposes)
Weekly T2108

*All charts created using TeleChart:

Related links:
The T2108 Resource Page
Expanded daily chart of T2108 versus the S&P 500
Expanded weekly chart of T2108
Be careful out there!
Full disclosure: long shares and calls on SSO, long VXX puts
