(T2108 measures the percentage of stocks trading above their respective 40-day moving averages [DMAs]. To learn more about it, see my T2108 Resource Page. You can follow real-time T2108 commentary on twitter using the #T2108 hashtag.)
T2108 Status: 17% (Day #16 of the current oversold period).
VIX Status: 40
General (Short-term) Trading Call: Only add to bullish positions on dips. Hold any remaining bearish positions as small hedges.
Commentary
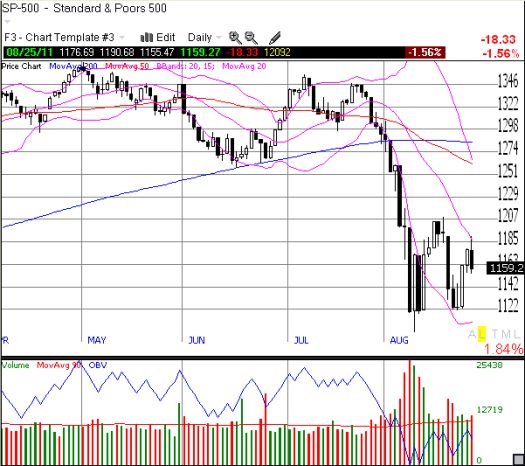
Yesterday, T2108 reached 19% exactly one week after it last hit this edge of oversold territory. Today, T2108 was stymied once again from finally exiting oversold territory. The market’s open was extremely promising with a surge of buying, but sellers quickly took over and kept up the pressure for the rest of the day. All of yesterday’s gains on the S&P 500 were erased. Note how the 20DMA served as resistance, turning this line into an important marker for the current downtrend.

At 16 days, this oversold period is now the THIRD longest since 1987 – tied with the oversold period in 2008 that immediately followed a 26-day streak. The longest was during the crash of 1987. In other words, we are officially at historic levels for an oversold condition. If you have hung in there through this, many kudos to you. Given the extreme nature of this oversold period, I no longer dare try to forecast when it may finally end. Certainly, if the recent lows do not hold, a fresh round of selling will challenge 2008’s historic panic (recall the trading rules for this scenario). Regardless, the main focus remains staying in the game to experience the rewards of a post-oversold rally. These rewards seem to grow larger, the longer this oversold period lasts.
Charts below are the latest snapshots of T2108 (and the S&P 500)
Refresh browser if the charts are the same as the last T2108 update.
Daily T2108 vs the S&P 500

Black line: T2108 (measured on the right); Red line: S&P 500 (for comparative purposes)
Weekly T2108

*All charts created using TeleChart:

Related links:
The T2108 Resource Page
Expanded daily chart of T2108 versus the S&P 500
Expanded weekly chart of T2108
Be careful out there!
Full disclosure: long shares and calls on SSO, long VXX puts
