(T2108 measures the percentage of stocks trading above their respective 40-day moving averages [DMAs]. To learn more about it, see my T2108 Resource Page. You can follow real-time T2108 commentary on twitter using the #T2108 hashtag.)
T2108 Status: 11% (Day #6 of the current oversold period).
VIX Status: 39.
General (Short-term) Trading Call: Only add to bullish positions on dips. Hold any remaining bearish positions as small hedges.
Commentary
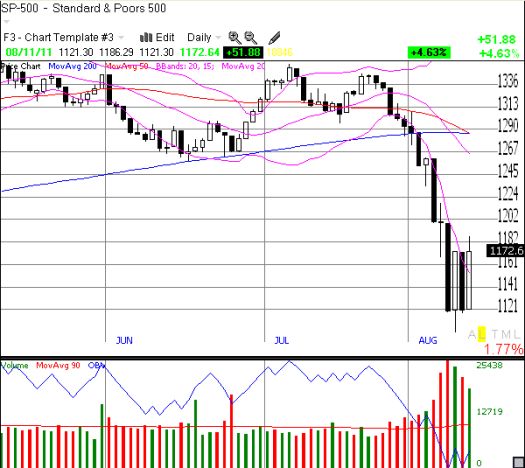
The trading robots and machines must really be in control of this manic market right now. The S&P 500 closed up 4.6% for its fourth straight 4%+ move. Amazingly, the opens and closes over the last three days are perfectly aligned – again, you just can’t make this stuff up.

Given this behavior, I fully expect an up day on Friday that takes the index to flatline for the week. It would be a poetic finish – almost as if nothing ever happened. The good news is that if you have followed the T2108 update trading calls, you will be up for the week, perhaps big, thanks to timely purchases.
Yesterday’s bullish divergence worked like a charm. T2108’s rise despite the decline in the S&P 500 provided a key sign of hope amidst the carnage. Today, T2108 moved up another two percentage points to 11%. This oversold period is now six days old which is the historical average duration. If all goes well, the market will finally depart the oversold doldrums sometime next week. At that point, it will make perfect sense to lock in some profits. Traders will need this cushion to provide the mental wherewithal to hang in there as we wait for the next oversold period OR other sell signal. (Note well that I do not have any standard rules regarding exit strategies after the oversold period ends, and the stock market can certainly drop right back into oversold conditions at any time).
Last night, I just happened to catch some local news coverage of Thursday’s stock market action. This lesson in market sentiment left me thoroughly dismayed. I understood even better how the general public can be whipped into a frenzy or one-way interpretation of the stock market action. The local news has all of 5 minutes or less to sum up the action, so the program must go for the biggest headlines and most dramatic spin. Last night’s coverage started with a somber anchor describing a market that opened down and went straight down all day. I guess it was the big fat red arrow pointing south on the TV screen that provided her with that interpretation. If you were not paying attention, you would have missed the contradiction later when viewers were shown the intraday action over the last 3 days, demonstrating that Wednesday’s market action included a small rally before the bulk of the day’s losses came in the final 2 hours or so.
That mistake would be excusable except that sandwiched between those contradictions was a litany of negative reinforcements brought in to highlight how bad the stock market was. People on the street were interviewed who expressed fear and concern over their investments. One woman was included who insisted it was a good time to buy, but she was drowned out by the screaming headlines. At no time did any anchor note that the market is extremely oversold. Instead, they latched on to the ready headlines of fallout from the S&P downgrade of U.S. debt and sovereign debt issues in Europe. No one mentioned what the stock market might fear AHEAD instead of BEHIND (perhaps a double dip recession?). Without proper context, one would think that the market is supposed to always go up.
I half expected the segment to end with an analyst who would recommend getting “defensive” by buying only high quality, blue chip stocks with reliable earnings and strong management…or trust a mutual fund that knows how to execute such a marvelous plan
Finally, I only sold one position into today’s rally given my forecast of perhaps an up day Friday and more upside next week to exit oversold conditions. However, I did take the opportunity to roundtrip on a few daytrades given what I felt was an “all systems go” signal from Wednesday’s bullish divergence; that is, a lot of stocks needed to play catchup! I also found great longer-term opportunities in dividend-paying stocks and some oil and natural gas plays that I will describe in later posts on this site and/or Seeking Alpha.
Charts below are the latest snapshots of T2108 (and the S&P 500)
Refresh browser if the charts are the same as the last T2108 update.
Daily T2108 vs the S&P 500

Black line: T2108 (measured on the right); Red line: S&P 500 (for comparative purposes)
Weekly T2108

*All charts created using TeleChart:

Related links:
The T2108 Resource Page
Expanded daily chart of T2108 versus the S&P 500
Expanded weekly chart of T2108
Be careful out there!
Full disclosure: long shares and calls on SSO

Another great post, as usual.
What, if anything, do you make of AAPL’s underperformance today?
I don’t make too much of it. 2.75% is still a pretty good day! More important to note that AAPL managed to stay above its 50DMA during this entire panic sell-off. This *should* mean it will be very strong during the next rally.