(T2108 measures the percentage of stocks trading above their respective 40-day moving averages [DMAs]. To learn more about it, see my T2108 Resource Page.)
T2108 Status: 69%.
VIX Status: 17.6.
General (Short-term) Trading Call: Hold. Start identifying new shorts.
Commentary
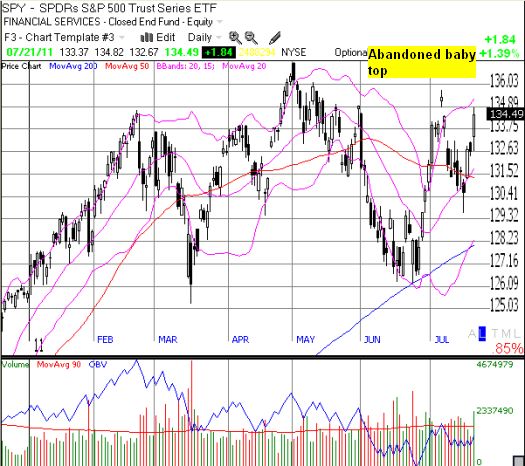
I am pretty surprised to see T2108 right back to the edge of overbought levels. This move completely invalidates my previous forecast of a drop to the low 30s before T2108 returned to overbought levels. Today, T2108 surged again, moving from 59% to 69% (overbought is 70% and above). The S&P 500 rose 1.4%. The chart below shows that the index, via the SPDRs ETF, is right on the edge of breaking through the resistance of the “abandoned baby top.” It was this pattern that gave me the firm conviction in a return to a bearish trend. If the abandoned baby top breaks, the S&P 500 will be in a very bullish position.

It seems odd that the stock market can be in such a good mood given the remaining uncertainty with the U.S. debt ceiling. As the August 2nd deadline looms closer, I am tempted to declare that the market is betting that all will be well on August 3rd…but then I would be paying too much attention to the news headlines. 🙂 (These T2108 updates are all about focusing on sticking to simple rules and executing them without distraction).
I suggested identifying fresh shorts because an overbought reading right at resistance is a powerful excuse to aggressively go short. I am waiting at least one more day before recommending sales of bullish positions: T2108 never reached low enough levels in the last cycle to warrant a recommendation to purchase fresh trading bullish positions.
Charts below are the latest snapshots of T2108 (and the S&P 500)
Refresh browser if the charts are the same as the last T2108 update.
Daily T2108 vs the S&P 500

Black line: T2108 (measured on the right); Red line: S&P 500 (for comparative purposes)
Weekly T2108

*All charts created using TeleChart:

Related links:
The T2108 Resource Page
Expanded daily chart of T2108 versus the S&P 500
Expanded weekly chart of T2108
Be careful out there!
Full disclosure: long puts on SSO, long SDS
