(T2108 measures the percentage of stocks trading above their respective 40-day moving averages [DMAs]. To learn more about it, see my T2108 Resource Page.)
T2108 Status: 59%.
VIX Status: 19.0.
General (Short-term) Trading Call: Hold.
Commentary
T2108 inched closer to overbought territory moving from 56% to 59%. The S&P 500 closed flat. An unexciting day.
Continuing on the thread of tech earnings, I noticed today under the surface that tech earnings are not as great and glowing as I had thought. For example, networking stocks are really getting hit hard this cycle. It makes me wonder whether Cisco’s (CSCO) year-long weakness is an early warning signal, rather than only company-specific woes. First CSCO, next fiber optic networking companies, and now general networking companies like Riverbed Technologies (RVBD) and First Five Networks (FFIV) are severely disappointing the market. RVBD dropped 23% today post-earnings. FFIV dropped 6% in sympathy and fell another 7% in after-hours post-earnings. Even Vmware (VMW) experienced a strong fade to close flat post-earnings. It was up as much as 10% or so last night in the after-hours and lost almost 7% from today’s open.
Based on these data points, I am certainly tempering any bullishness I was starting to allow to creep into my pysche!
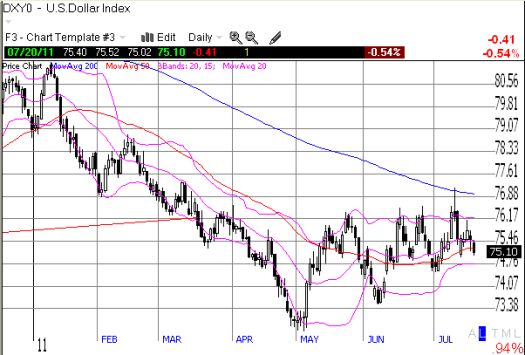
Finally, I need to correct an important omission from last week. I somehow completely missed the dollar index’s failed test of its 200DMA. I have frequently written about the importance of the 200DMA in determining the U.S. dollar’s future direction (see for example “Another Critical Juncture for the U.S. Dollar Index“). Last week’s failure suggests that the dollar is likely getting weaker even as it churns in a tight 2-3 month trading range. I am expecting at least one more retest that will more definitively suggest where the dollar goes from here. The implication of dollar weakness is that it will likely translate into stock market strength…unless of course the dollar is selling off because the U.S. falls into a technical default on its debt…

Charts below are the latest snapshots of T2108 (and the S&P 500)
Refresh browser if the charts are the same as the last T2108 update.
Daily T2108 vs the S&P 500

Black line: T2108 (measured on the right); Red line: S&P 500 (for comparative purposes)
Weekly T2108

*All charts created using TeleChart:

Related links:
The T2108 Resource Page
Expanded daily chart of T2108 versus the S&P 500
Expanded weekly chart of T2108
Be careful out there!
Full disclosure: long puts on SSO, long SDS, long CSCO, net long U.S. dollar
