(T2108 measures the percentage of stocks trading above their respective 40-day moving averages [DMAs]. To learn more about it, see my T2108 Resource Page.)
T2108 Status: 51%.
VIX Status: 21.
General (Short-term) Trading Call: Hold.
Commentary
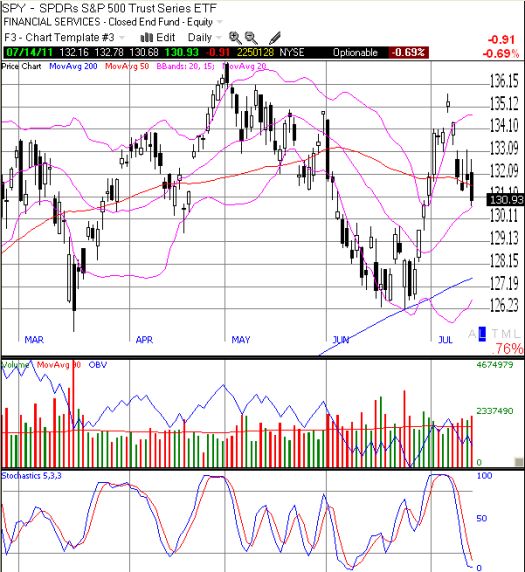
T2108 dropped to 51% from 61%. My favorite technical indicator spent the previous three days bouncing in a tight range after tumbling hard out of overbought territory. Today’s fall confirms the resumption of a bearish bias to the market. Adding to this bias is the fourth weak close in a row for the S&P 500. Moreover, the index has dropped below its 50DMA again, putting the 200DMA in play. Volume has slowly risen along with the selling. The chart below uses the SPDRs S&P 500 Trust Series ETF (SPY). Note how July’s peak with the abandoned baby top stands out so starkly and with strong resolution.

The one important caveat to this bearish chart is that the stochastics for SPY are now flashing oversold (see the bottom indicator in the SPY chart). At best, I think this oversold condition helps the SPY nudge back to the 50DMA before selling resumes again.
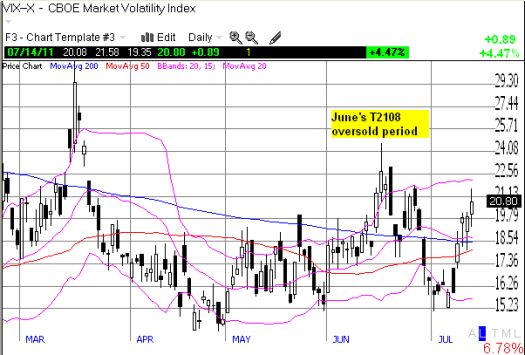
The volatility index, VIX, has been rising over the past week. This is another ominous signal given the VIX is right back where it was during the previous T2108 oversold period. Given the “preponderance of evidence,” I am assuming this divergence is a bearish divergence. That is, T2108 is on its way to “catching” up to the VIX.

My first bearish target for T2108 is the lower 30s. Again, this area has served as a bottom most of the time since the March, 2009 lows. June’s oversold period was one of two important exceptions. A break below those levels should generate enough momentum to return T2108 to oversold conditions. In other words, I am firmly biased to the short side in the coming days or weeks – which just happens to coincide with the clock running out on the debt ceiling talks…
Charts below are the latest snapshots of T2108 (and the S&P 500)
Refresh browser if the charts are the same as the last T2108 update.
Daily T2108 vs the S&P 500

Black line: T2108 (measured on the right); Red line: S&P 500 (for comparative purposes)
Weekly T2108

*All charts created using TeleChart:

Related links:
The T2108 Resource Page
Expanded daily chart of T2108 versus the S&P 500
Expanded weekly chart of T2108
Be careful out there!
Full disclosure: long puts on SSO, long SDS
