(T2108 measures the percentage of stocks trading above their respective 40-day moving averages [DMAs]. To learn more about it, see my T2108 Resource Page.)
T2108 Status: 70% and overbought.
VIX Status: 16.
General (Short-term) Trading Call: Close more bullish trades (longs), initiate new bearish trades (shorts).
Commentary
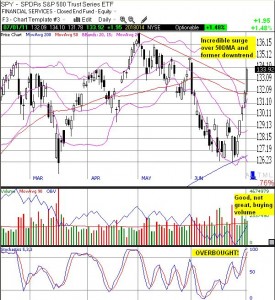
The S&P 500 closed the week with a 5.6% gain, up 1.4% just on Friday. The S&P 500 made an extremely impressive surge above the downtrend line (see below), above the 50DMA, and stretched even further above the upper Bollinger Band. This was far ahead of even my most bullish hopes. Yesterday, I mentioned I would be happy if the market could manage to close flat and remain above the 50DMA.
From my reading, this was the S&P 500’s best week since the week-ending July 16, 2009! (Interesting coincidence that T2108 closed that week at 70%, just like today). The next best performance was a 5% gain the week-ending June 15, 2010. So, you can be excused if you left a lot of money on the table this week, as I did, locking in profits all the way up these past five days. There was simply no reason to incorporate a near 6% up-week in managing risk/reward. In other words, the lesson learned from this week is NOT to buy more aggressively and hold longer after the next oversold period. However, we can be reassured that the T2108 methods worked like a charm again in keeping us focused on the short-term opportunities even as market sentiment seems to point in the exact opposite direction.
Speaking of pointing in the opposite direction, it is now officially time to initiate fresh shorts. As I mentioned in yesterday’s update, I recognize this mental shift will be quite challenging. At the beginning of the week, I was not even contemplating any imminent overbought readings on T2108. Even yesterday, I forecast a breach into overbought territory at the “current rate” by early next week. The S&P 500 is overbought and over-stretched in every imaginable way: T2108 is at 70%, stochastics are overbought, and the index is about 2% above the upper Bollinger Band. Interestingly enough, buying volume is pretty good, so the bulls at least have price-volume momentum firmly on their side. (Note that I will start referring to the SPY chart rather than the S&P 500. SPY displays opening price levels much more accurately).
Click graphic for a larger view

Given the current momentum, this is not the time to get aggressively short, but assuming a subsequent pullback could be almost as strong as this rally, shorts could eventually be very rewarding once the market drops out of overbought conditions. If T2108 gets to 80%, it will definitely be time to get a lot more aggressive with shorts with the usual cautions if the stock market resumes a strong upward trend (that is, a condition where overbought simply stays overbought. Read more in “Using the Percentage of Stocks Trading Above Their 40DMAs (T2108) to Identify Overbought Conditions on the S&P 500“). In the meantime, brace yourselves for some very volatile action, especially as important news headlines crisscross with critical technical levels.
Charts below are the latest snapshots of T2108 (and the S&P 500)
Refresh browser if the charts are the same as the last T2108 update.
Daily T2108 vs the S&P 500

Black line: T2108 (measured on the right); Red line: S&P 500 (for comparative purposes)
Weekly T2108

*All charts created using TeleChart:

Related links:
The T2108 Resource Page
Expanded daily chart of T2108 versus the S&P 500
Expanded weekly chart of T2108
Be careful out there!
Full disclosure: long SSO puts
