(T2108 measures the percentage of stocks trading above their respective 40-day moving averages [DMAs]. To learn more about it, see my T2108 Resource Page.)
T2108 Status: 31% and Neutral.
General Trading Call: Continue covering shorts. Start adding small long positions.
Commentary
As I suspected, yesterday’s oversold bounce was short-lived. The selling today was strong, persistent, and overcame another attempt to rally into the close. T2108 hit 24%, almost a 52-week low. Only two other cycles have reached these levels since the March, 2009 lows: October, 2009 and the summer of 2010 (starting with the flash crash of course).
This is where things get “interesting.”
My examination of the “sell in May” adage found that each summer month tends to take the stock market to or past May’s highs at some point. This year, the May highs are also multi-year highs, so I cannot imagine a rally THAT strong from these levels in the next 3 weeks (not impossible of course). My follow-up to that analysis discovered, much to my surprise, that the summer tends to produce positive returns. Recently, years without positive returns have generated very poor summer performance. In other words, summer has been high risk, low reward on average. Given the negative May and now a very bad June, we are likely firmly in the high risk, low reward category for bulls.
Under these conditions, I will be more aggressive with shorts, especially in overbought conditions (although we will be LUCKY to get technically overbought anytime soon!) and even more cautious with longs. Notice my strong reluctance to recommend executing any longs even as T2108 reached my first downside target of the lower end of 30-40% and especially when the stock market briefly bounced out of that range. (As a reminder, I am talking about short-term/swing trading here).
T2108 is almost oversold and at post-March, 2009 extremes, so it makes a lot of sense to start speculating in a few fresh longs for swing trades. I will likely bring such trades to an end quickly, on whatever rally comes along next. As an example, I bought calls on Bank of America (BAC) near the Friday’s close as I noticed call volume surging. BAC’s chart looks awful with the stock at 2-year lows and sinking like a rock for almost all of 2011. But this is the exact kind of play that can experience a sharp, short, yet profitable spike just because the selling has temporarily exhausted itself. (I posted this trade on twitter with my #120trade hashtag).
On Friday, I also sold some of my SSO puts as part of the trading call to keep covering shorts – again, posted on twitter with my #120trade hashtag. The lower T2108 goes at these levels, the FEWER shorts I want to hold.
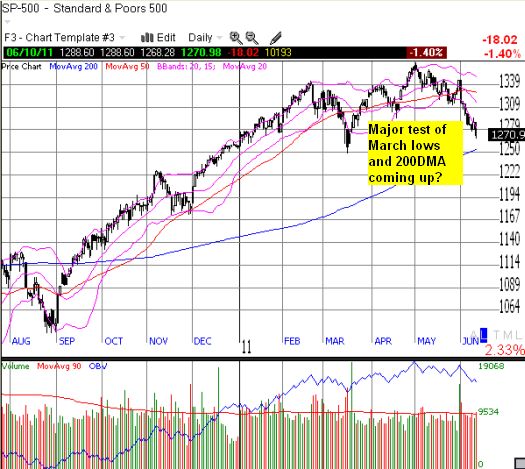
I am not interested in getting any more aggressive with longs until T2108 hits the 20% threshold. Even then, I am keeping an eye on key technical levels on the S&P 500. June’s plunge now looks like a train wreck pointed straight to the March lows which coincidentally now coincides with the 200DMA. The bulls and buyers should put a spirited defense at that point, especially given the extreme oversold conditions that should exist on such a test. A break of the 200DMA and March lows will create serious technical damage to the S&P 500’s chart, but let us not get ahead of ourselves just yet.

Charts below are the latest snapshots of T2108 (and the S&P 500)
Refresh browser if the charts are the same as the last T2108 update.
Daily T2108 vs the S&P 500

Black line: T2108 (measured on the right); Red line: S&P 500 (for comparative purposes)
Weekly T2108

*All charts created using TeleChart:

Related links:
The T2108 Resource Page
Expanded daily chart of T2108 versus the S&P 500
Expanded weekly chart of T2108
Be careful out there!
Full disclosure: long SSO puts
