(T2108 measures the percentage of stocks trading above their respective 40-day moving averages [DMAs]. To learn more about it, see my T2108 Resource Page.)
T2108 Status: 42% and Neutral.
General Trading Call: Hold. Identify some shorts to cover.
Commentary
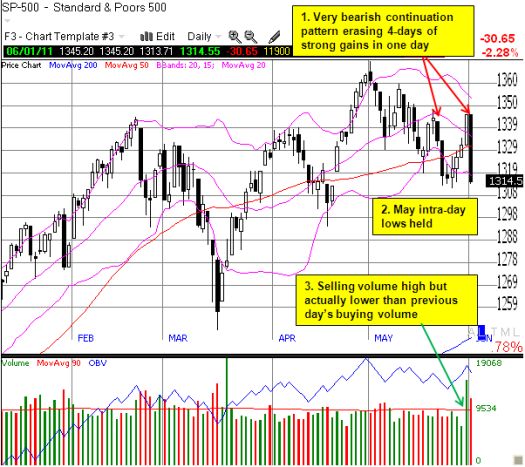
Given that today was the stock market’s worst performance since August of last year, I should expect to get caught well off guard. Yet, this provides little consolation for extrapolating yesterday’s strong follow-through rally to an imminent return to overbought territory. Such are the perils of trying to read the tea leaves. The good news is that I noted the time was not to buy but to sell and prepare to short. My quote from yesterday is ringing VERY true today: “I am expecting fireworks for the summer from beginning to end.” We have started with MAJOR fireworks. (Also see my analysis of summer trading where I observe that the summer tends to end positively but produces very large losses when it ends negatively).
T2108 cratered back to 42% as the S&P 500 plunged 2.3%. The S&P 500 dropped right back toward the May lows, putting it right back into the thick of the former short-term downtrend. If the S&P 500 closes below the May lows, we should expect continued selling closer to oversold levels on T2108. So, I am reviving my downside target of the lower part of the 30-40% range for this cycle and aborting my previous assessment that we had re-entered an upward phase to over-bought territory.

*Chart created using TeleChart
The dollar index did not soar as I would have expected. Instead, it was the Swiss franc that soared, recording all-time highs against the U.S. dollar, euro, and the pound. The Japanese yen was also strong, and the currency has regained its losses from yesterday’s downgrade warning from Fitch. It almost seems that on up days, we look to dollar weakness and down days we look to franc and yen strength. I am still developing and refining my understanding of who leads whom, but I think we can expect a lot more volatility in the stock market aided by jittery gyrations in foreign exchange.
Charts below are the latest snapshots of T2108 (and the S&P 500)
Refresh browser if the charts are the same as the last T2108 update.
Daily T2108 vs the S&P 500

Black line: T2108 (measured on the right); Red line: S&P 500 (for comparative purposes)
Weekly T2108

*All charts created using TeleChart:

Related links:
The T2108 Resource Page
Expanded daily chart of T2108 versus the S&P 500
Expanded weekly chart of T2108
Be careful out there!
Full disclosure: long SSO puts, net long short Swiss franc, net long Japanese yen, net long U.S. dollar, net short British pound, net short the euro
