(T2108 measures the percentage of stocks trading above their respective 40-day moving averages [DMAs]. To learn more about it, see my T2108 Resource Page.)
T2108 Status: 51% and Neutral
General Trading Call: Hold.
Commentary
T2108 jumped to 51% today. The week close as I expected it would. From the T2108 update on Wednesday:
“Notice that the S&P 500 could rally back to 1334 or so and still remain within the current downtrend. This level would be Monday’s high, so, I will not be surprised if we get such a rally by Friday before sellers return to close out positions ahead of the holiday weekend.”
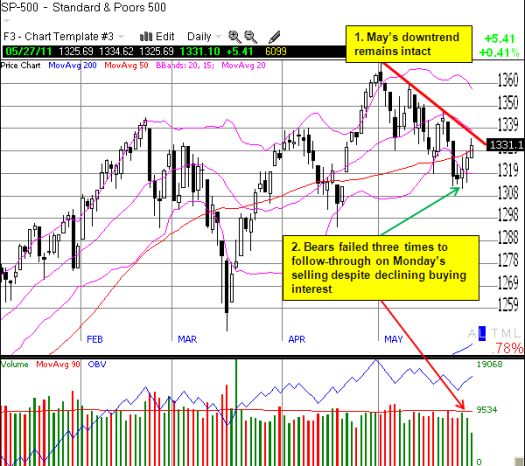
Friday’s high was 1334.62, a fraction above Monday’s high. However, the pullback from the high was not dramatic and was only three points. This overall move ended the week flat – likely a very frustrating result for bears who thought Monday’s sharp one-day decline signaled lower prices to come. The bears failed three days in a row to break the market to fresh lows on the month. This produced a tendency for the market to drift ever higher with even the 50DMA giving way on Friday. Buying volume declined throughout so bulls have nothing to roar about either.
I am expecting selling on Tuesday to set up a “first of the month rally” to start June. Given this expected churn, I cannot recommend new trading shorts even though the S&P 500 is resting right against the resistance of the short-term downward trend.
Here is the chart of the S&P 500 with some labeling to make more clear the downtrend and the failure of the bears to build on Monday’s decline:

Charts below are the latest snapshots of T2108 (and the S&P 500)
Refresh browser if the charts are the same as the last T2108 update.
Daily T2108 vs the S&P 500

Black line: T2108 (measured on the right); Red line: S&P 500 (for comparative purposes)
Weekly T2108

*All charts created using TeleChart:

Related links:
The T2108 Resource Page
Expanded daily chart of T2108 versus the S&P 500
Expanded weekly chart of T2108
Be careful out there!
Full disclosure: long SSO puts
