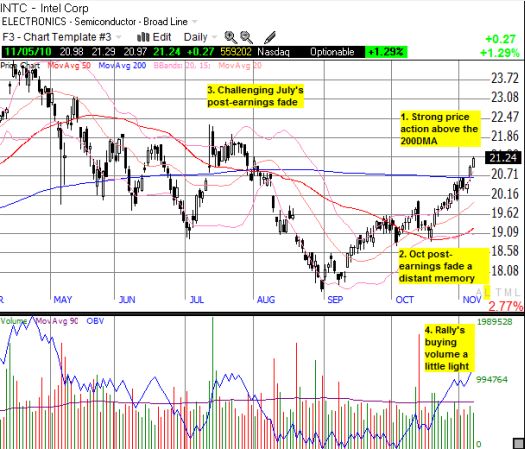
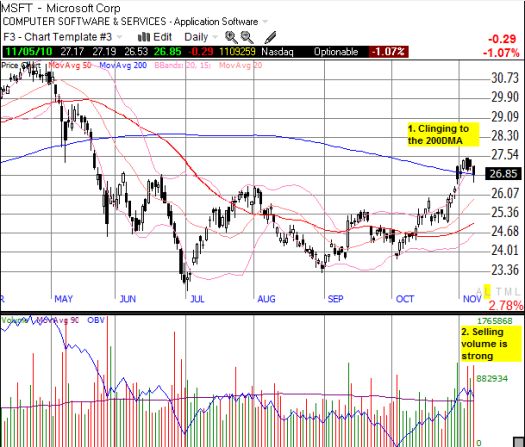
Intel (INTC) and Microsoft (MSFT) have been tech laggards for some time now. However, over the past week, both stocks finally breached the all-important 200-day moving average (DMA) line of resistance (charts at the end of this piece). While MSFT is struggling to add to its small post-earnings gains, INTC has completely reversed the post-earnings fade in October and is now working on regaining ground lost after July’s post-earnings fade that generated a major bearish set-up.
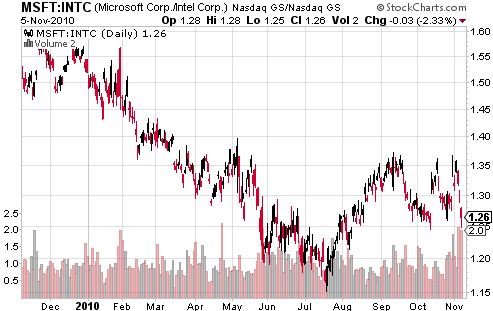
This trading action has created yet another pairs trade advantage for INTC. The chart below shows that the 1.35 – 1.37 level is holding as resistance for the MSFT:INTC ratio. This week’s drop from that resistance line was the most dramatic since May’s market correction.

Source: stockcharts.com
When I last wrote about the MSFT:INTC trading relationship, I described my disappointment at a sub-par execution of the related pairs trade (MSFT puts vs. INTC calls). I stated I would wait until Microsoft’s next earnings report to enter the trade again. As it turned out, the MSFT:INTC ratio bounced, then moved favorably (down) before the MSFT report, bounced after the report, and finally moved down very favorably this past week. Unfortunately, I was too distracted with earnings from the solar sector to recognize that my next opportunity had come.
So now, I will try to bide my time again, looking for a bounce in this ratio to get long INTC and short MSFT.
The charts below that the technicals of the individual stocks give INTC the slight edge. It is certainly possible that CEO Steve Balmer’s massive stock sales have put some additional pressure on MSFT shares. If so, the overhang could persist through the end of the year as Ballmer plans to sell 75 million more shares by year-end (average daily trading volume has been 62 million shares over the past three months).


*All charts created using TeleChart:

Be careful out there!
Full disclosure: no positions
