Three weeks ago, I generated a list of stocks that demonstrated strong buying volume over the previous five days. During those five days, the S&P 500 finally broke out above the June highs but volume remained anemic and unimpressive. I figured focusing in on the stocks that did exhibit good buying volume during that important week would uncover very promising plays. Now that earnings season is about to kick into high gear, I thought it would be a good time to check in how these stocks performed, especially since my list was not generated to predict the market’s reaction to the earnings of individual stocks.
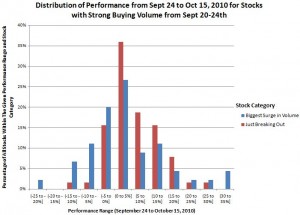
As a group, these stocks with strong volume performed at least as well as the market with a sizeable group well out-performing the market. That is, the average performance (~4.7%) for these stocks out-performed the market, as we should expect. Even more interesting was that, in the aggregate, the stocks that were “just breaking out” performed better than the stocks which were soaring on strong uptrends (see below).
Here is a reminder of the two category of stocks that made up this collection of strong stocks:
- 64 stocks where average volume increased during that week, prices increased, and the stock was 8% or less above its 200-day moving average (DMA). The 200DMA was also above the 50DMA. These criteria defined stocks that were just breaking out and could provide a better risk/reward for “chasing” the rally (if you dared). I labeled this list “Just Breaking Out.”
- 45 stocks where average volume doubled during that week, prices increased, and the stock was trading above its 50 and 200DMAs. This list was dominated by stocks in very strong uptrends where price action also surged during that week. I labeled this list “Biggest Surge in Volume.”
From September 24 to October 15, 2010, the S&P 500 gained 2.4% while the NASDAQ gained 3.7%. Over this same time period, 45% of the “Just Breaking Out” stocks gained over 5%. 52% of the “Just Breaking Out” stocks performed in the “noise” of -5% to 5%. 33% of the “Biggest Surge in Volume” stocks gained over 5%. 47% of the “Biggest Surge in Volume” stocks performed in the nose of -5% to 5%. The graph below shows the entire distributions side-by-side. Note how the distributions are skewed to the right.
(Click for a larger view)

Refer to the previous post for the list of individual stocks.
At this point, if you are in any of these positions for a short-term trade, you should probably lock in profits if you have not done so already: the stock market continues to loiter around extremely overbought levels. The percentage of stocks trading above their respective 40DMAs, T2108, has now been over 70% for 27 straight days, the 95th percentile of duration for overbought periods. T2108 has even been over 80% for 16 straight days.
Be careful out there!
Full disclosure: no positions
