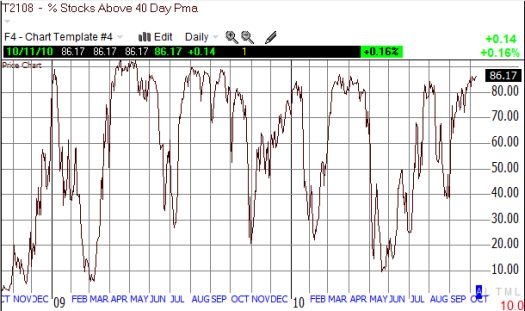
The S&P 500 is now just 5% away from its 52-week highs has remained aloft at overbought levels for 23 straight trading days. T2108, the percentage of stocks trading above their respective 40-day moving averages (DMAs) is trading at 86% and is well above the 70% threshold for overbought conditions. It has even traded above 80% for an impressive 12 days.

At these levels, T2108 is around the 94th percentile of all overbought periods since 1986. At this rate, the market will keep meandering with a slight upward bias until the November elections finally provide a selling catalyst (sell on the news), or maybe the Fed decides the stock market has done so well that quantitative easing part 2 is not needed after all (I think the former is much more likely than the latter). Just some scenarios to keep in mind…
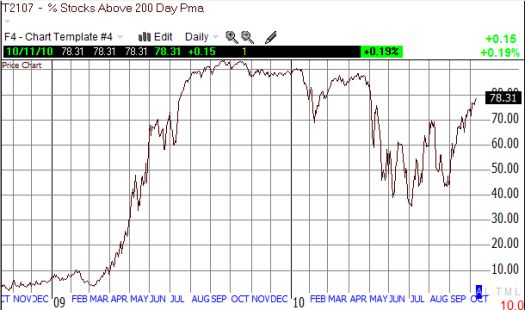
Anyway, even T2107, the percentage of stocks trading above their respective 200 DMAs, is increasing at a healthy clip every week. My summertime assumption that this indicator would continue trending downward did not work out.

*All charts created using TeleChart:

Be careful out there!
Full disclosure: no positions
